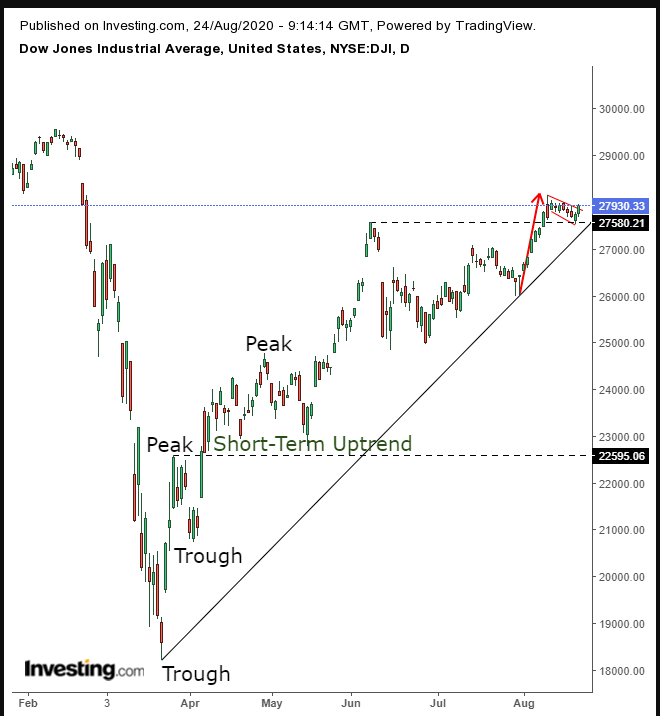
It's no secret that we've been uncomfortable with the current equity rally since the March bottom. In April, US stocks entered a short-term uptrend, as can be seen in the following Dow Jones Industrial Average chart.

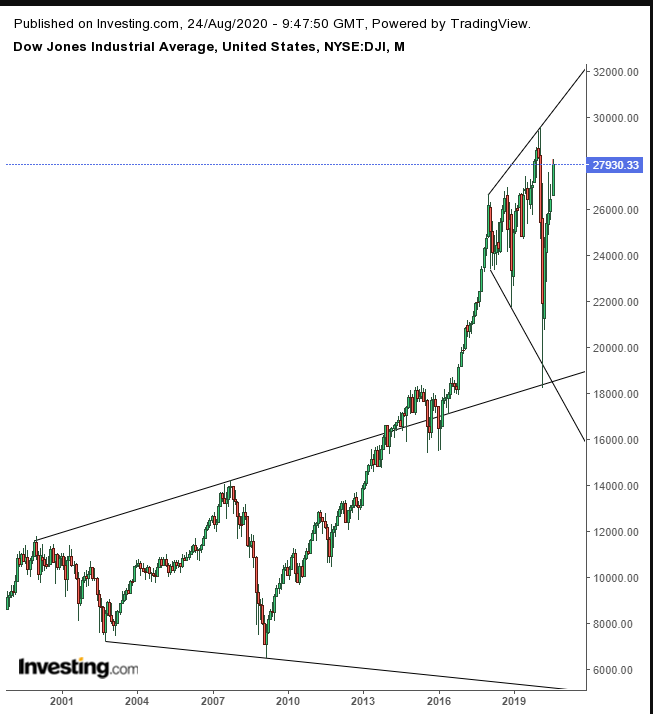
Nevertheless, the once-in-a-century global pandemic and its economic devastation, including the fastest bear market on record and the worst recession since the Great Depression, has left us frightened still. Additionally, the long-term trend for equities has been sideways, as can be seen in the following monthly chart.

Not only has trading been sideways, but the lower lows and higher highs have been developing a broadening pattern since January 2018. That means this rangebound activity has been going on for three years, a structure that generally tends to take several months.
The dynamics of this type of trading range is a loss of leadership and potentially the start of a major move to follow. In classic technical analysis, it is said to be a top.
However, the one that developed from 2000 blew out in 2014. To reiterate, the dynamics that dominate a pattern assumed to be a top—upon a downside breakout—are meant to last for months (or at least that's what has always been the case, as far as we know).
But in an alternative economy, as is that created by Fed quantitative easing, savers are punished as rates, including bond yields, remain low, tempting investors to borrow at ultra-low rates and leverage themselves fully into stocks, which provide the promise of higher returns and infinite profits...much like infinite QE itself.
So, though we're still very uncomfortable with this rally, we must recognize the following reality: after the S&P 500 Index entered a long-term uptrend last week, joining the NASDAQ Composite, the mega-cap Dow Jones Industrial Average is likely to follow. We’re also betting that President Donald Trump will pull out all the stops to support the equity rally ahead of his reelection bid.
He's already pressured the FDA to fast-track convalescent plasma as an emergency treatment for COVID-19 and threatened drugmakers with an ultimatum to lower pricing. As well, he's flip-flopped on banning US companies from doing business with Chinese owned WeChat.
As such, though we continue to harbor reservations, we’re going to recognize the potential bullish pattern shown in the Dow’s daily chart, above.
The 30-component index may have completed a falling flag—a period in which the early bulls cash out following a quick, 8% surge, while bullish newcomers pick up where the older ones left off to take up what they believe is a repeat-move. The upside breakout demonstrates that the new buyers absorbed all the available supply from the first-leg bulls and were forced to increase their offers to find new, willing sellers at higher prices.
The breakout may force a short squeeze and trigger longs, propelling prices yet higher. The expectation is that the newer bulls will want to earn as much as the earlier bulls and therefore carry prices the same distance. Note, the flag is supported by the June 8 high, reinforcing its bullish dynamic.
Trading Strategies
Conservative traders may want to wait for the falling gap to be closed, or even for a new high, before risking a long position below such powerful technical forces.
Moderate traders might risk a long position after a close above the flag’s high point of 28,155.
Aggressive traders may buy into a position at will, after writing a trading plan that fits their budget, timing and temperament.
Trade Sample
Entry: 28,000
Stop-Loss: 27,800
Risk: 200 points
Target: 30,000
Reward: 2,000 points
Risk:Reward Ratio: 1:10
Note: This is just an example. The article carries the message. If you didn’t read and understand it, don’t trade. Also, the sample doesn't and can’t suit everyone. Tailor a trading plan for your personal needs, based on your account, timing and risk aversion. If you don’t know how to do that, do not trade, unless you’re willing to lose the money as an education exercise.
