This article was written exclusively for Investing.com
As we near the end of another month, investors’ insatiable appetite towards risk remains intact, with several major global stock indices trading at or near record highs. Sentiment remains supportive towards equities and other assets that stand to benefit from a rebound in economic growth, which is well and truly underway in many regions, as lockdown measures continue to ease and travel slowly resumes thanks to ongoing Covid-19 vaccinations programmes.
On top of this, huge monetary support continues to flood the financial markets. Most policy makers at major central banks have persistently dismissed inflation concerns, with the likes of the Federal Reserve and European Central Bank keeping their asset purchases programmes running at full throttle.
Knowing that central banks have their backs, investors have therefore had little reason to turn bearish towards stocks, with momentum-chasing traders happy to buy every short term dip back to support.
In Europe, investors have also been piling into equities as the ECB remains one of the most dovish central banks out there. Unsurprising, the German DAX has been one of the strongest European indices as it has repeatedly climbed to new all-time highs recently. And judging by Thursday’s price action, it is potentially on the verge of hitting another fresh high soon.

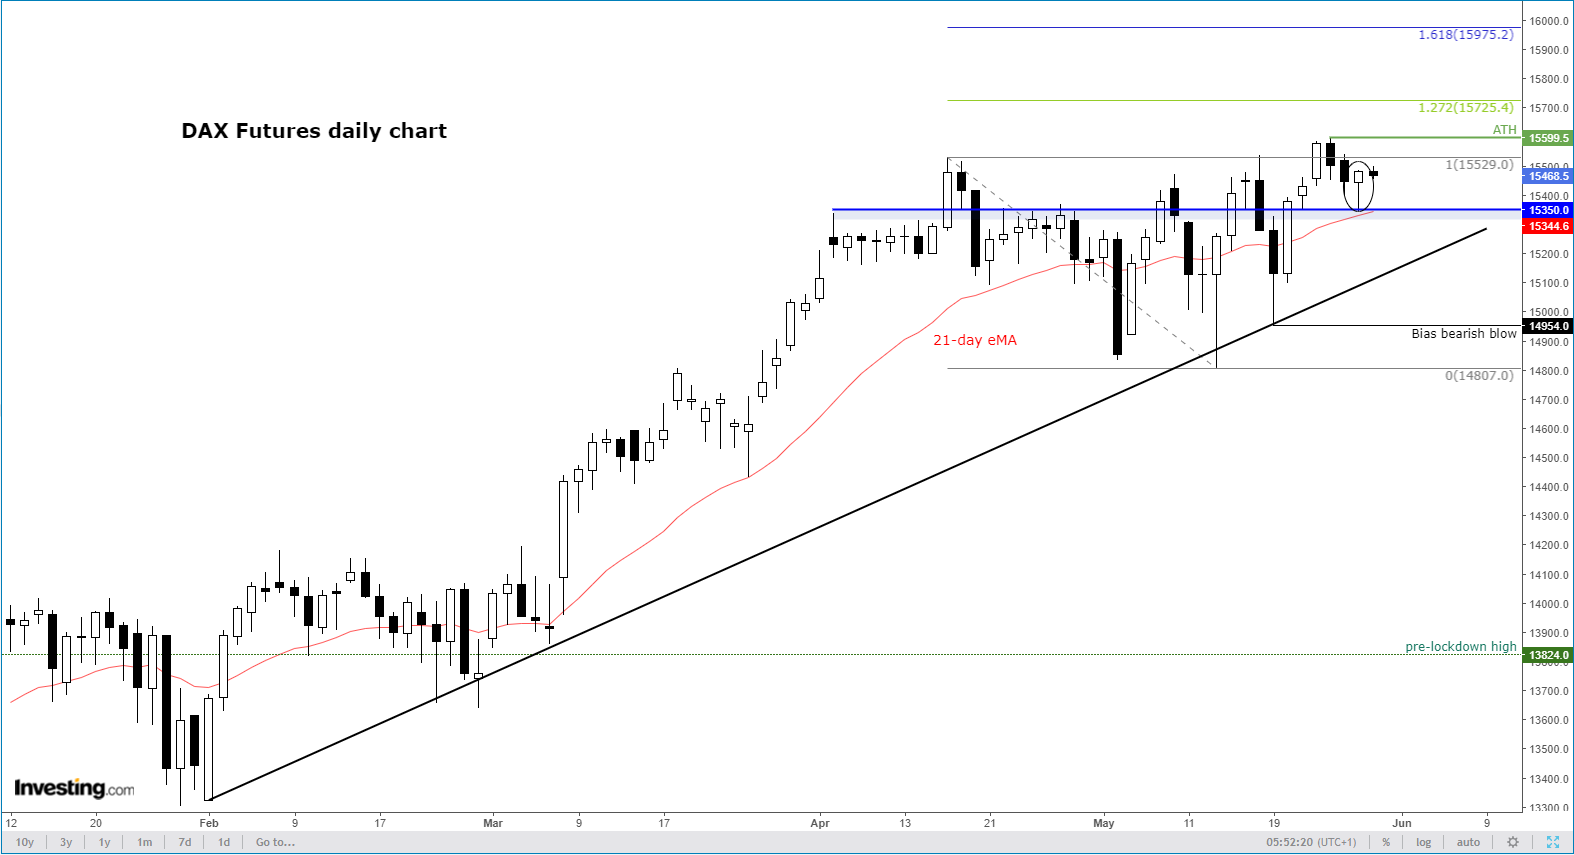
As per the daily chart, the DAX has been pulling back for a few days as it consolidated its recent gains. But on Thursday, the German index created a key bullish signal as it formed a hammer-like candle on the daily time frame. The buyers stepped in to defend a pivotal level around 15,350, which had acted as both support and resistance in recent weeks.
The hammer candle often precedes gains in a rising trend as it clearly indicates a reversal from previous selling to buying pressure. The fact that this hammer was formed around the still-rising 21-day exponential moving average makes it even more compelling. This particular moving average is often used as a key technical tool by trend followers, as it reflects the short term directional bias in an objective way.
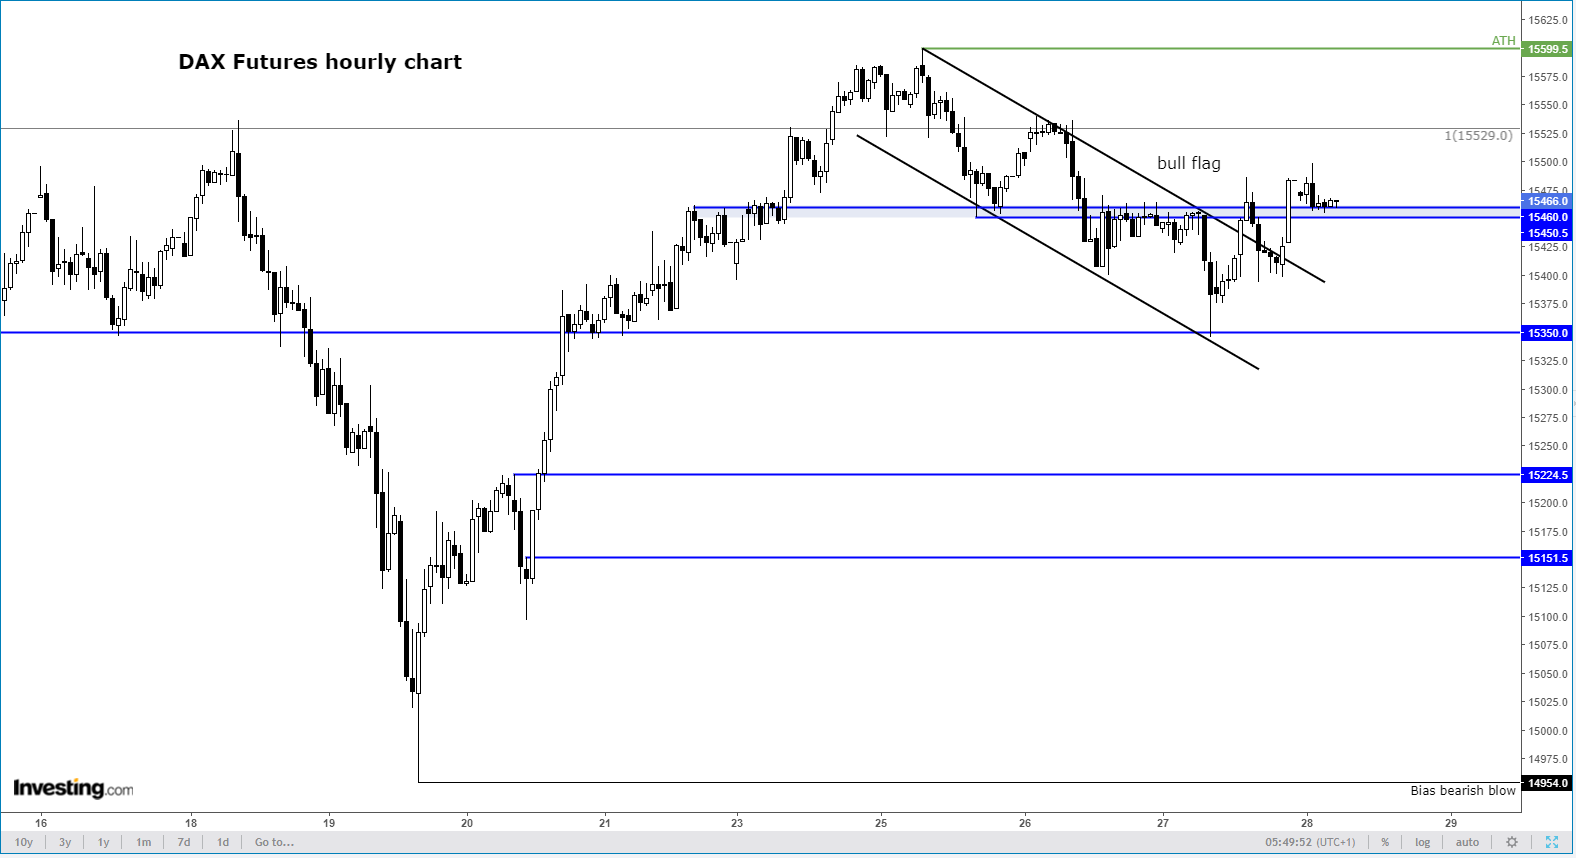
On this occasion, we have also seen a breakout from the hourly bull flag pattern. This is another bullish signal as it indicates that after a period of consolidation, the market is now ready to make further gains as the selling pressure remains low.

From here, the next bullish objectives are: (1) 15,540, the high from last week, followed by (2) 16,600, the all-time high. Subsequent bullish objectives could be the Fibonacci extension levels shown on the chart.
There is little point in discussing bearish targets yet as selling in a rising market is not a good idea until the tide turns. We will cross that bridge when we get there, but for now the DAX clearly remains in an uptrend and thus for traders buying the dips—even at these levels—make more sense than looking for shorting opportunities at resistance.
