Lately, Treasury yields have been running the show. That catalyst, in place since the Fed slowed the path of tightening due to an economic outlook that turned sour, suggests the global slowdown is catching up with the U.S.
A sudden shift from risk-on to risk-off late last week caused investors to dump stocks in favor of the safety of U.S. Treasurys. That sent 10-year yields plunging below 3-month Treasurys at rates not seen since 2007 — ahead of the 2008 crash — when the worst depression since the 1930’s was brewing.
Today, however, yields are on the rise. That makes investors optimistic that the inversion was nothing more than a knee-jerk reaction, which in turn means the worst global stock market selloff of the year has now turned into a buying opportunity. S&P 500 futures are in the green, suggesting their underlying benchmark will open higher, potentially rebounding from a two-day selloff.
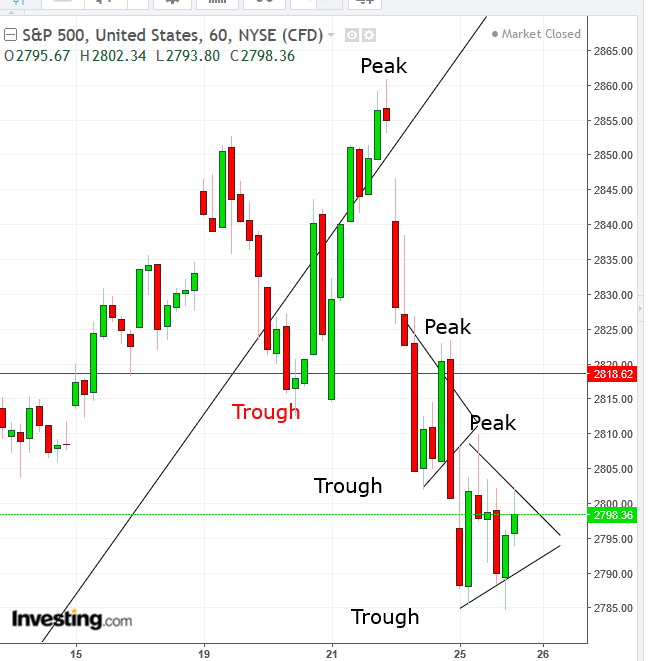
They certainly might. However the following technical chart indicates an overall continued selloff could be more likely.

The SPX fell below its uptrend line since the December rout, then proceeded to violate the previous trough to finally form a descending series of peaks and troughs, pointing to the direction of momentum.
As it did all that, it completed a double-top, followed by back-to-back bearish pennants. A downside breakout of the current pennant, yesterday’s trading pattern, would signal a continued selloff and the extension of a reversal to a short-term downtrend.
To clarify, this is an analysis based on the hourly chart. On the daily chart, the trend is still up, in the direction of its peaks and troughs.
Trading Strategies
Conservative traders should wait for the daily chart to form a descending series of peaks and troughs before considering a short.
Moderate traders may be content with a downside breakout, below the 2,780 level and return move to the 2,790 level in a return-move that would successfully retest the pennant, with at least a single long, red candle, engulfing a green or small candle of either color.
Aggressive traders might risk a short position now, provided they understand the risk and trade accordingly, with a prepared plan that fits their account. Otherwise, they’re not aggressive 'traders' but rather gamblers.
Trade Sample
- Entry: 2,800
- Stop-Loss: 2,810, yesterday’s high
- Risk: 10 points
- Target: 2,760, measuring the sharp (2-hour) move before the pause of the pennant
- Reward: 40 points
- Risk-Reward-Ratio: 1:4
