S&P 500 slides as jobs data fan worries about economy
A batch of big companies listed on the NASDAQ Composite are scheduled to release corporate results this week and investors have been warned they shouldn't expect them to be pretty. Analysts have been predicting for weeks that this earnings season will be the worst since the 2008 meltdown.
While that cataclysmic market collapse was the fallout of shady financial engineering, the current crash is the result of the economy coming to an almost total halt as governments attempt to stem the global coronavirus pandemic through stringent lockdown measures imposed on communities across the U.S. and the world.
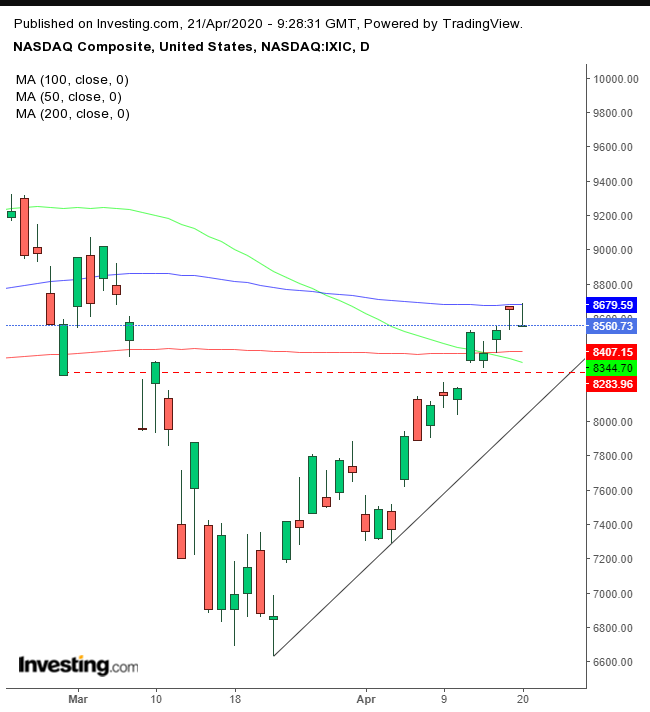
The consequences for many companies have been dire: plummeting sales, frozen operations and inactive work forces. Just how damaging the blow has been will start to emerge with their earnings results; in the meantime, the chart below can offer some guidance on the technical picture that's developing.

Monday’s trading produced a candle with a double whammy: a gravestone doji — demonstrating a failed bullish attempt to gain ground and confirming Friday’s hanging man — which led bulls, egged on by the hanging man’s advance, to close positions after the subsequent lower close. It's also possible that the hanging man’s advance was the result of short covers.
The hanging man and gravestone doji took place precisely below the 100 DMA, after the 50 DMA crossed last week below the 200 DMA, triggering a dreaded Death Cross, the most infamous technical milestone among economists and fundamental analysts.
The NASDAQ Composite is in an uptrend. A fall below the uptrend line since the March 23 bottom would raise the risk of a further decline, till it posts a new trough below the March 23 low, establishing a new bear market — after bouncing out of the bear market triggered by the COVID-19 pandemic that lasted only three weeks, an historic first.
For now, we expect a pullback toward the 8,300 area, where the Feb. 28 trough meets with the uptrend line below the Death Cross.
Trading Strategies
Conservative traders would wait for the decline and if they recognize demand above the 8,000 levels, would probably add to their positions.
Moderate traders may buy the dip, before waiting for support confirmation.
Aggressive traders could short the expected fall, providing they understand it goes against the trend and are willing and able to risk their capital.
Trade Sample - Short Position
- Entry: 8,600 – upon a rally to retest resistance
- Stop-Loss: 8,700 – above yesterday’s highs
- Risk: 100 points
- Target: 8,300 – presumed support
- Reward: 300 points
- Risk:Reward Ratio: 1:3
Note: A trade sample is a device to convey the key components of a coherent trade plan. Not every trade can win. No trade is suitable for all traders. Feel free to change the entry points, stop-loss and target per your temperament and capital, but you must trade according to your preset plan, or your trade results — good or bad — will be meaningless.
