- Cryptos rebound with Bitcoin, Ethereum surging as tariff delay bolsters market confidence.
- Ethereum nears breakout at $1,720 EMA with SEC, Pectra updates as potential catalysts.
- XRP tests $2.25 resistance; Ripple lawsuit outcome crucial for upward trajectory.
- Looking for actionable trade ideas to navigate the current market volatility? Subscribe here to unlock access to InvestingPro’s AI-selected stock winners.
The recent uncertainty caused by global trade wars has reduced risk appetite and deeply affected the cryptocurrency market. The total cryptocurrency market capitalization fell as low as November 2024 levels in the first week of April, giving back all the gains made by the Trump rally.
In the process, Bitcoin gained as much as 15% on a move towards $85,000 after testing below $75,000. Among the altcoins with large market capitalization, Ethereum recovered close to 20%, BNB 15%, XRP and SOL 30%.
However, given the bearish trend since December, the current rebound does not yet signal a clear trend reversal. Nevertheless, technically critical levels have been reached, and the possibility of a new directional breakout is strengthening.
Cryptocurrencies started to recover after US President Donald Trump announced a 90-day delay on tariffs. This helped ease market pressure and boosted investor confidence. News over the weekend about possible tax exemptions for the tech sector also lifted the mood. However, there is still a lot of confusion and mixed information about this.
At this point, although uncertainty about tariffs continues, the fact that the markets have largely priced in these developments and the lack of new negative news may create an opportunity for a short-term recovery.
Ethereum Gains Support
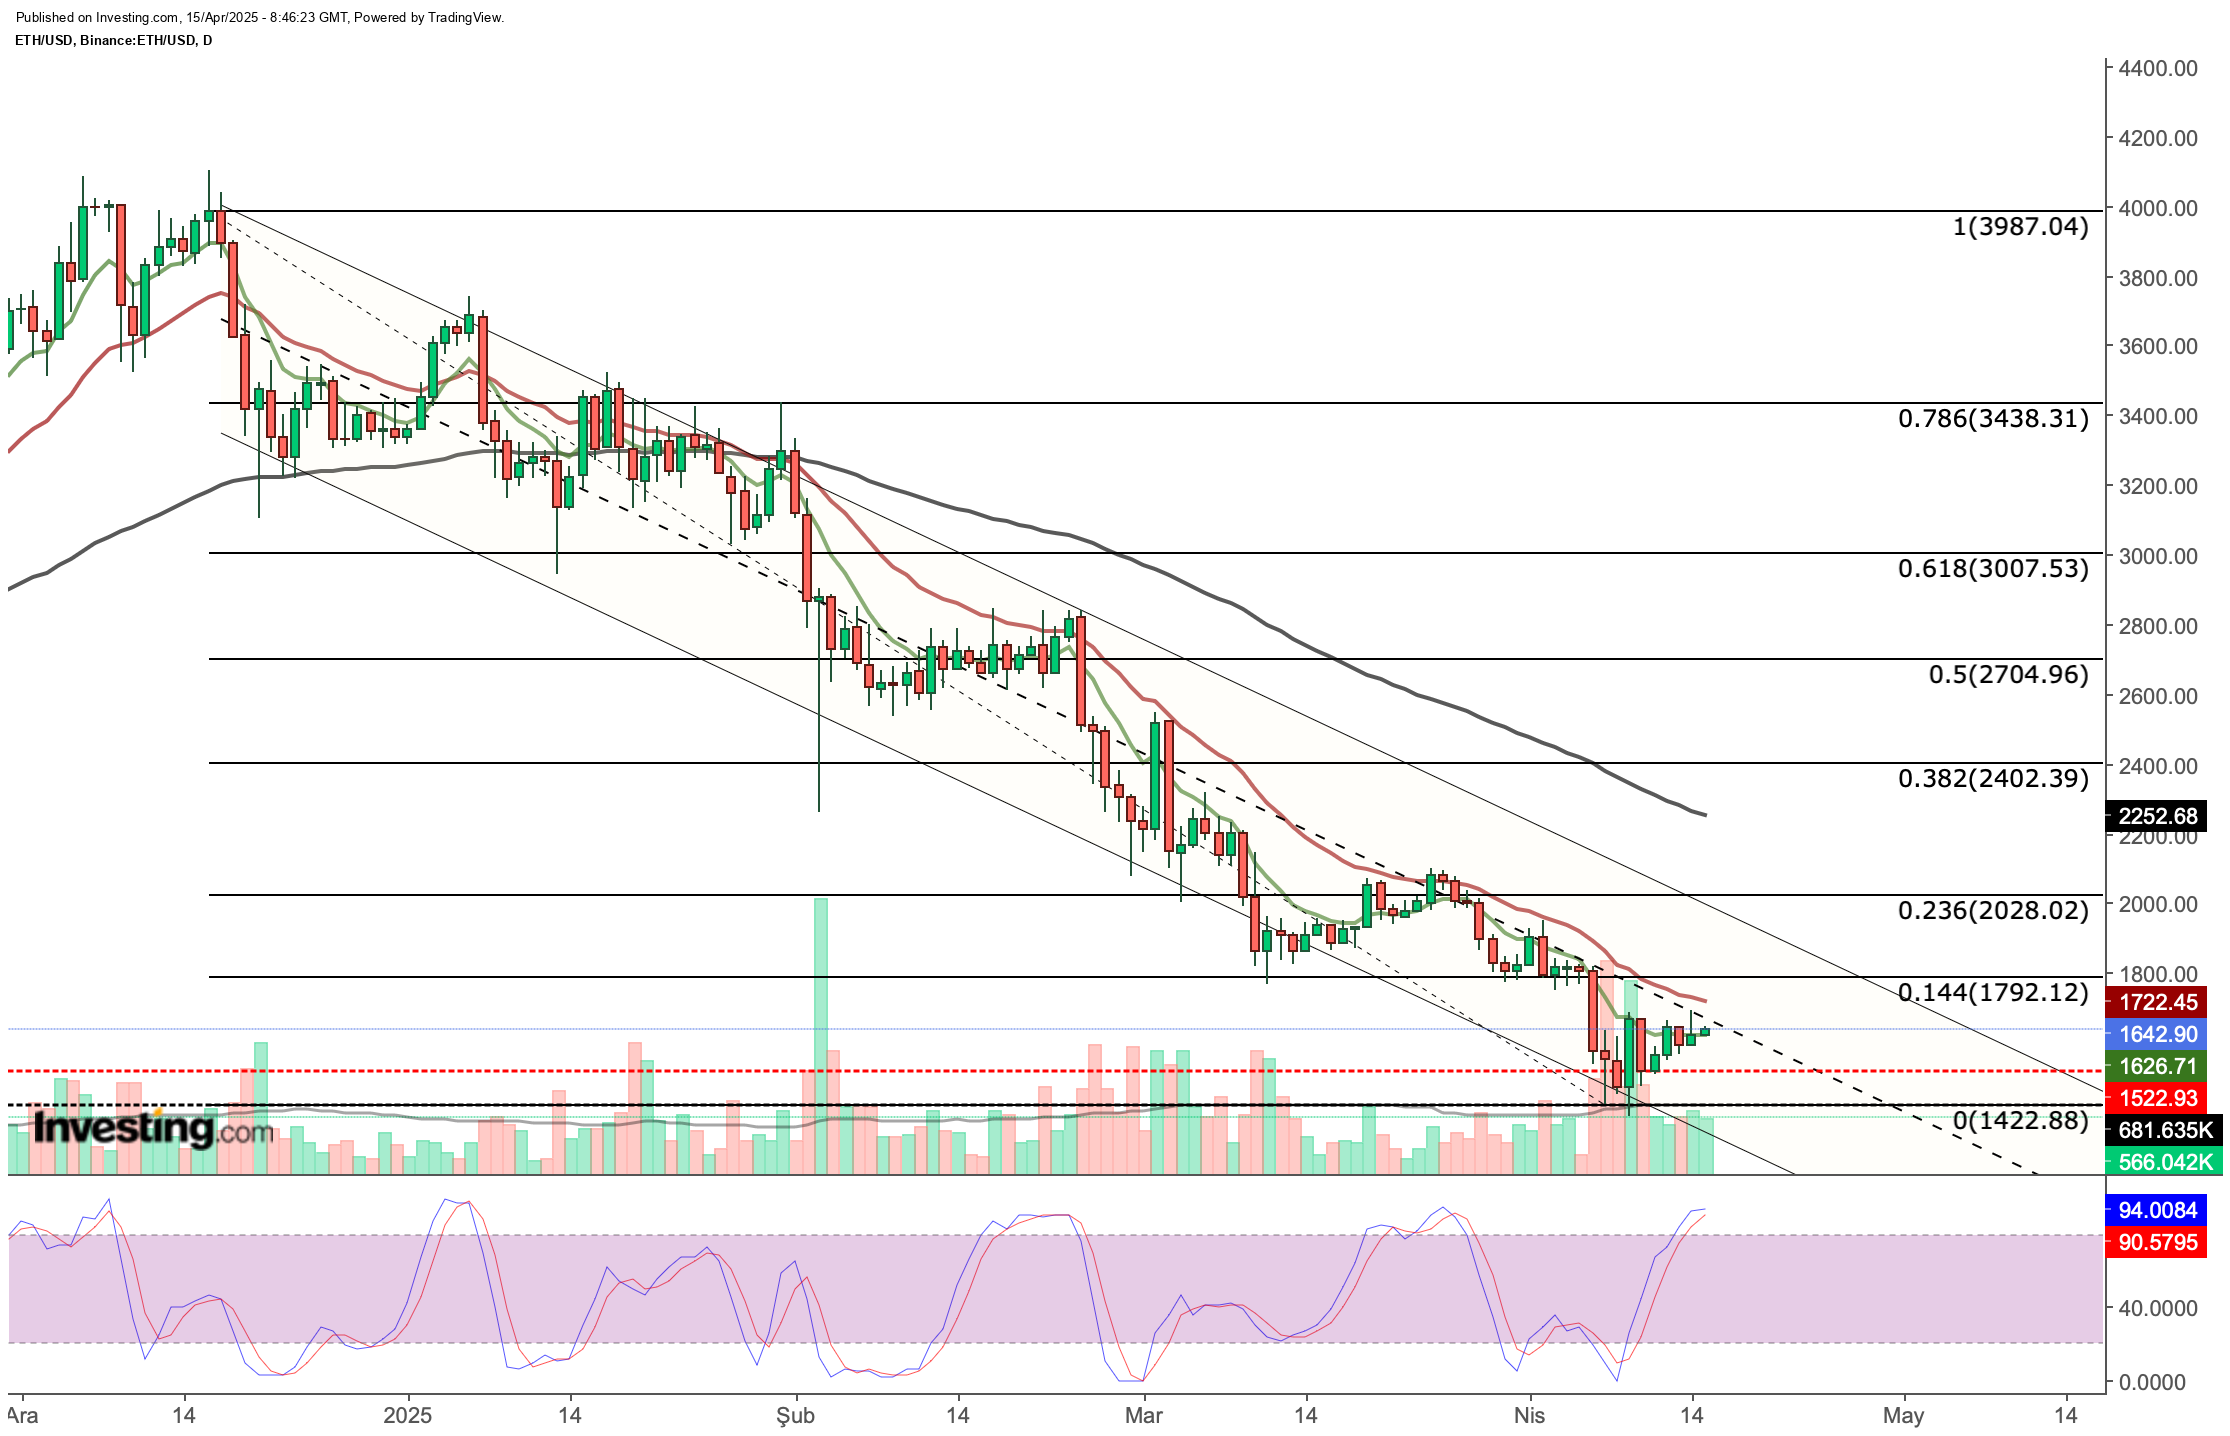
Ethereum continues to move by maintaining the falling channel pattern. Finally, with the purchases coming from the average level of $ 1,420, which corresponds to the lower band of the channel, ETH rose to $ 1,600. However, the recovery has slowed down in the middle band of the channel.
In order for the recovery to continue, the 21-day EMA (average $ 1,720) level corresponding to the middle band is critical. Daily closes above this level could be an important signal for the trend to break to the upside. In this case, with a test of the $1,900 level and an upside breach of the channel, it may be possible for ETH to head towards the $2,200-2,400 band.
On the other hand, selling pressure at the $1,700 level could push ETH back to lows below $1,400. Two important developments may affect the Ethereum market in the coming period: The postponement of the Pectra update and the SEC’s postponement of the staking decision for Ethereum ETFs until June. If successful, these developments could be important catalysts for ETH.
XRP Stuck at Critical Thresholds
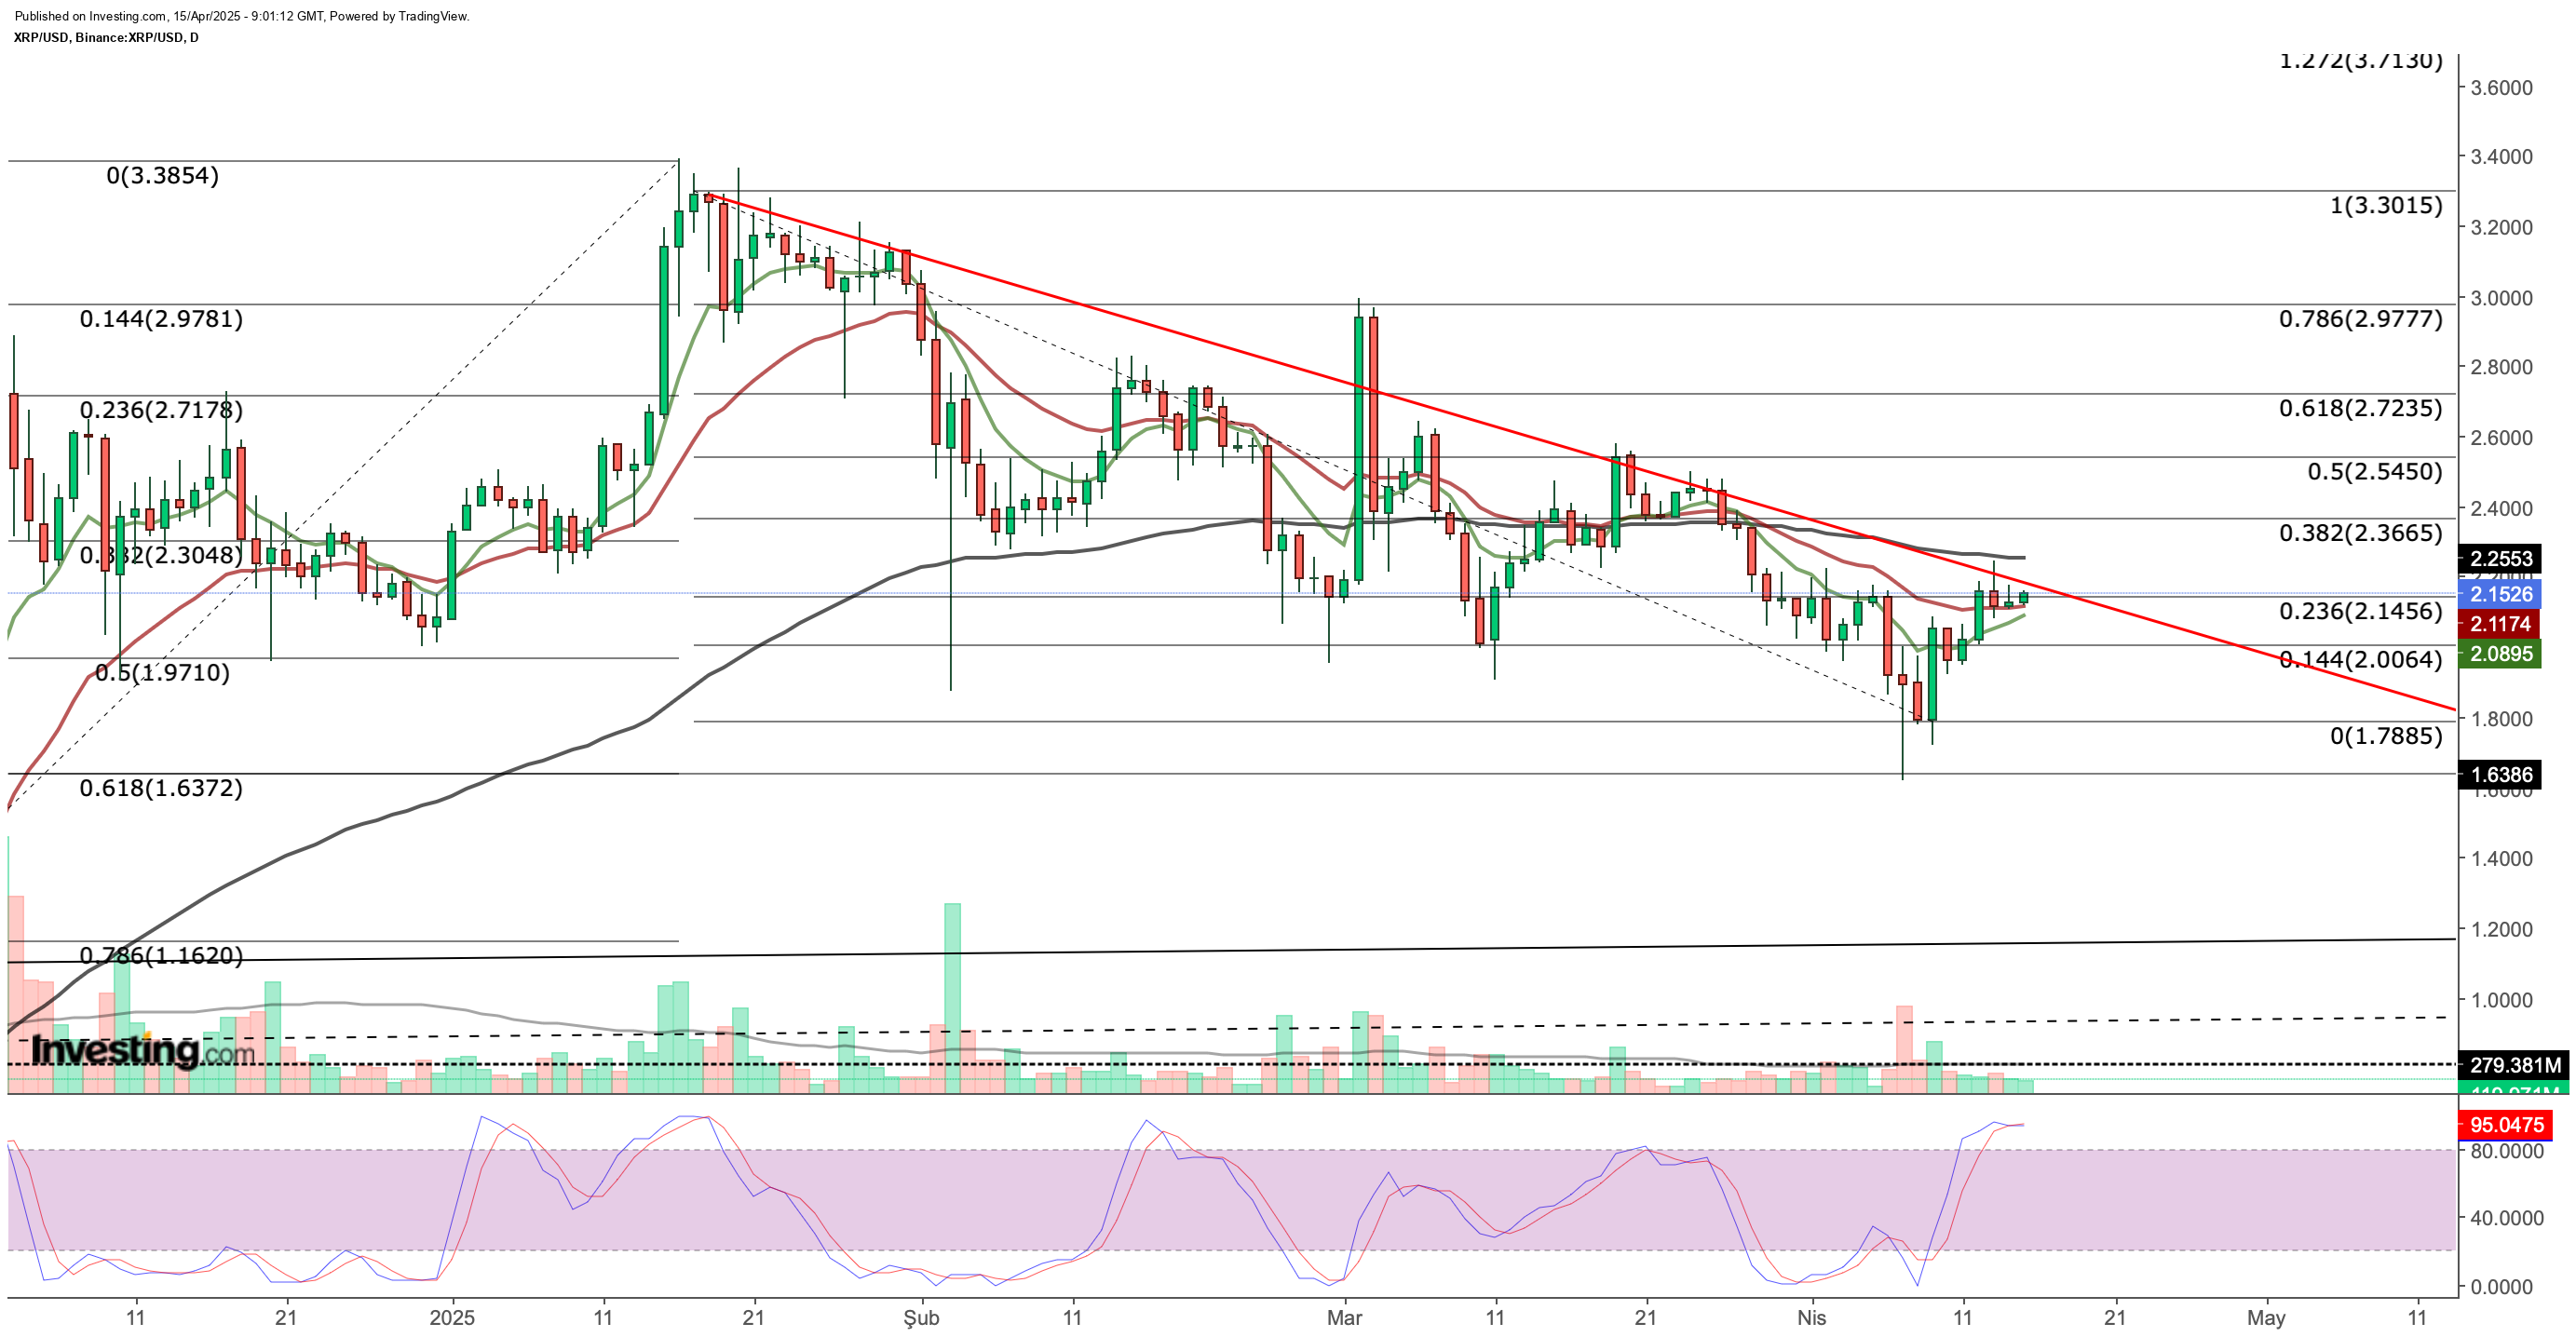
 XRP has climbed back to the $2 level after falling as low as $1.62 in recent days. However, the rise is limited at the resistance of $ 2.15. Currently, $ 2.11 stands out as support and $ 2.25 as resistance.
The persistence of the XRP price above $ 2.25 may technically bring the $ 2.36-2.50-2.75 targets to the agenda, respectively. Otherwise, the $2 level will act as a critical support. If this point is broken, the price may fall back to the $ 1.60-1.80 band and then to $ 1.15.
If the deal is formalized in Ripple’s ongoing lawsuit with the SEC, it could be a significant upside trigger for XRP. However, uncertainty remains and possible selling pressure is still on the table.
Price Squeezes on BNB
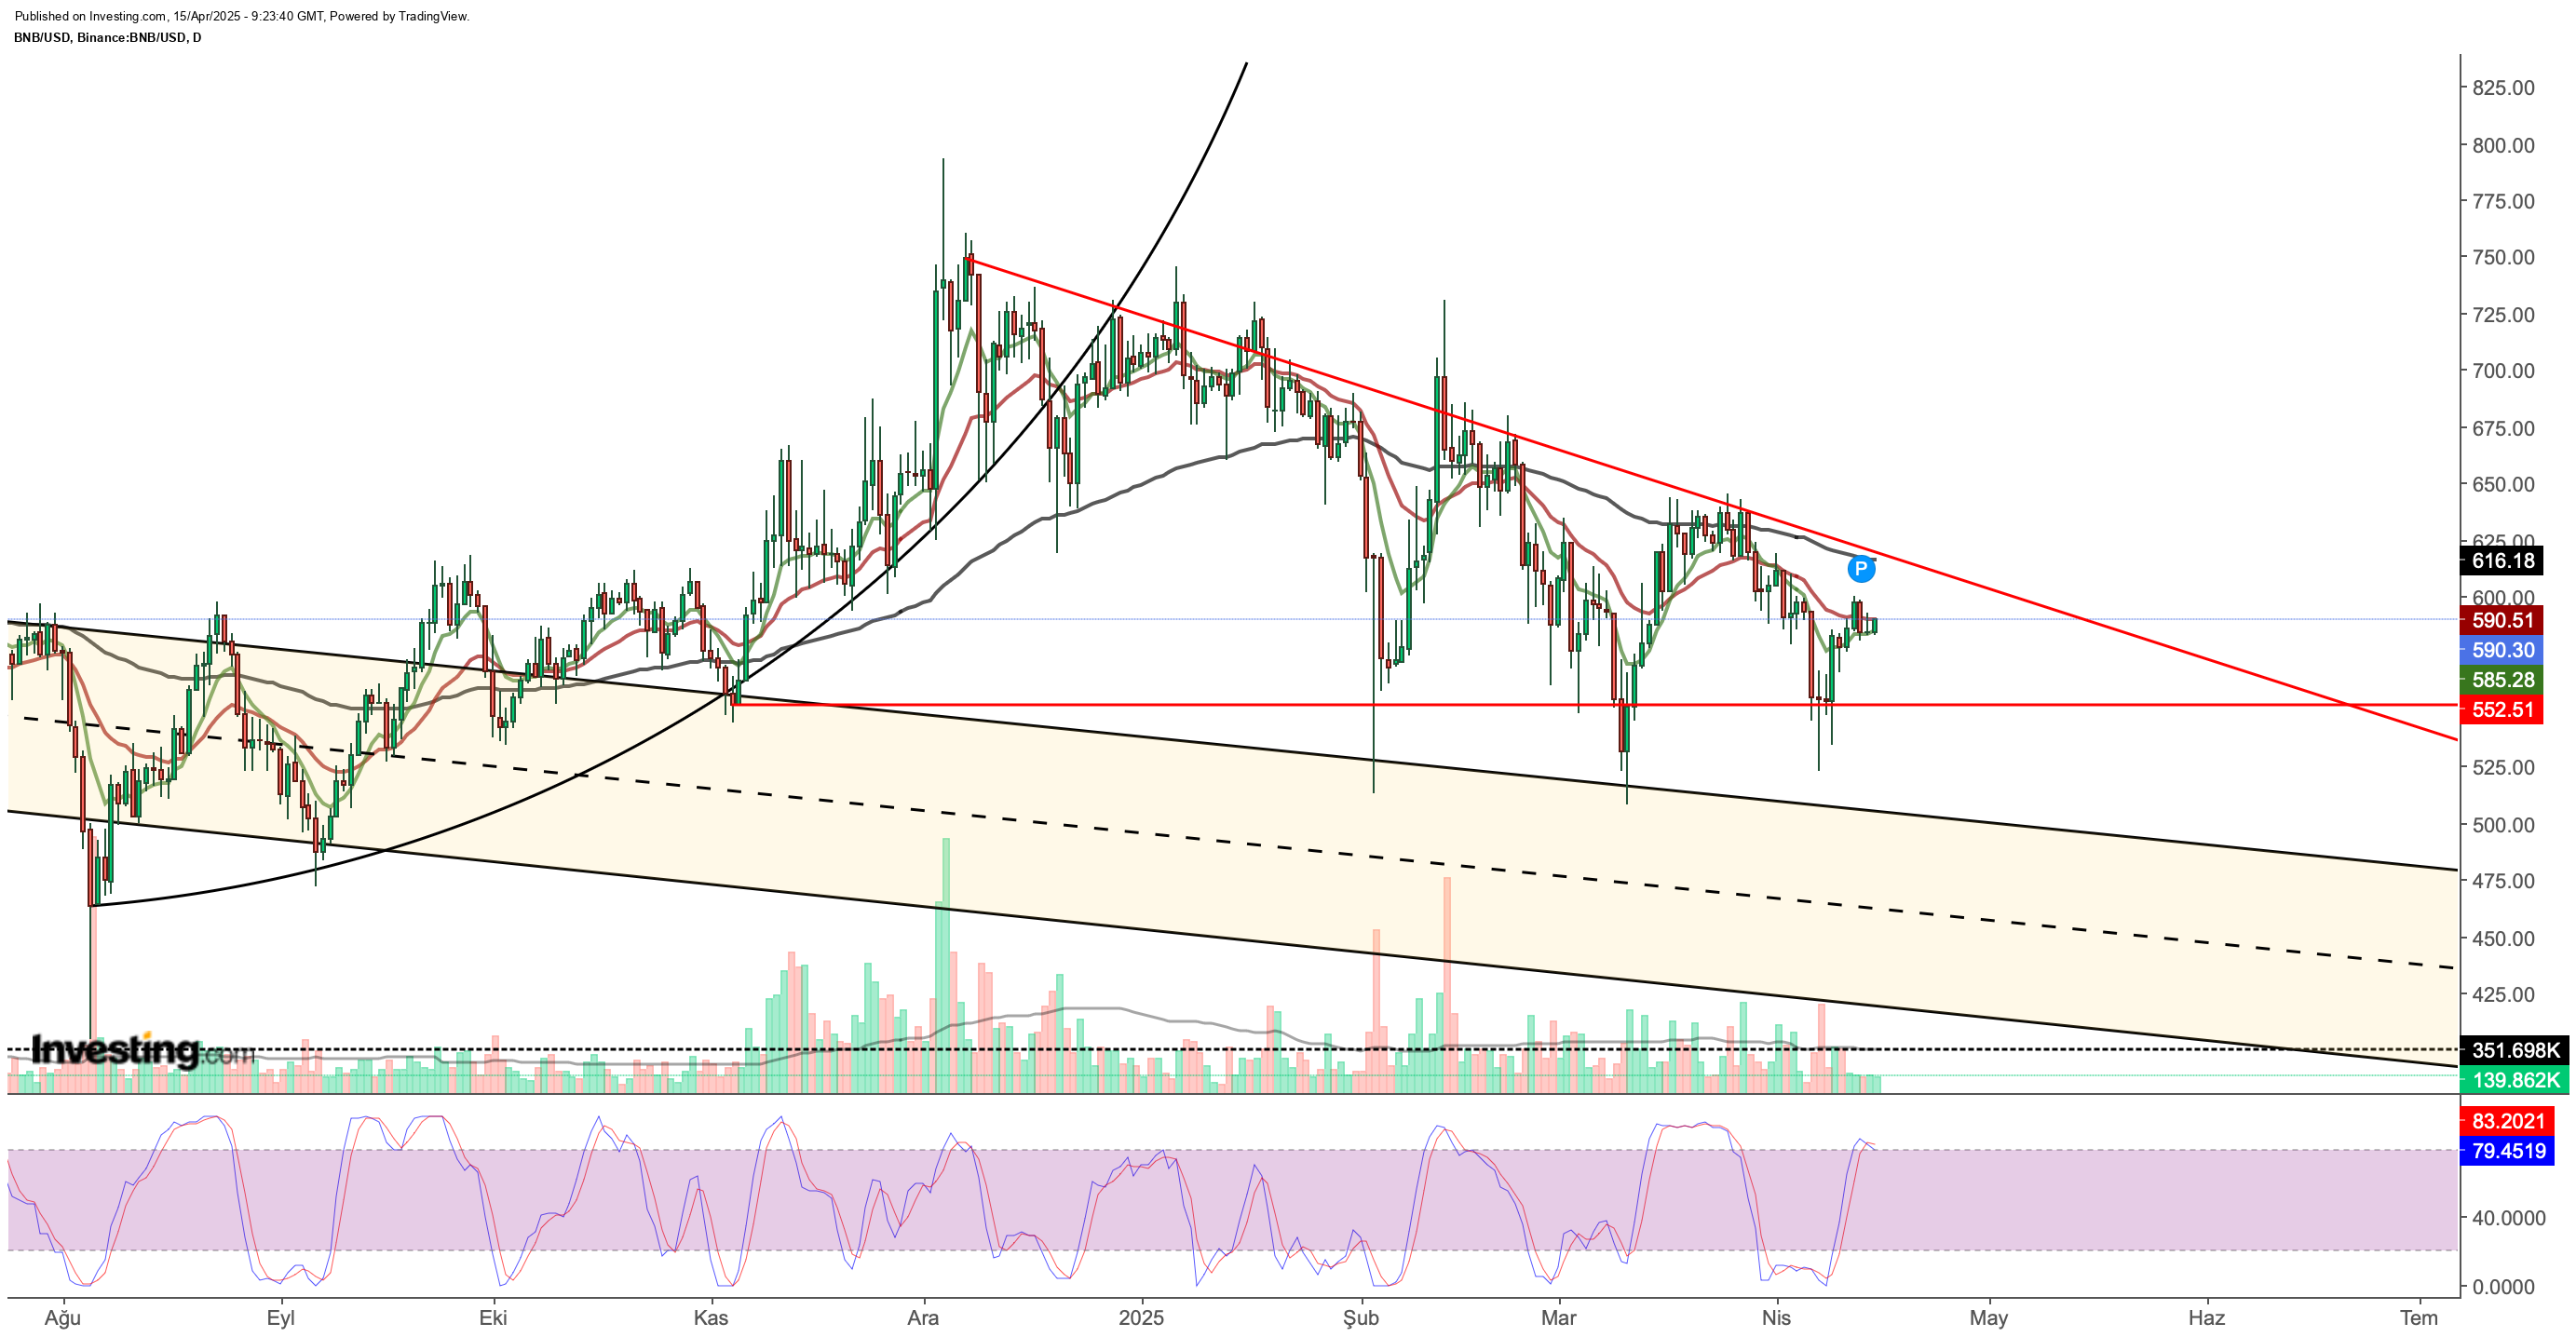
BNB Although it tested below $550 in the first quarter of the year, support was maintained with purchases from this region. Technically, this level is still the critical lower limit. However, the downward trend continued with lower peak formations in the rises.
The last recovery seems to have slowed down in the $585-590 band. Exceeding this region and crossing the $ 615 level may be the beginning of an upward trend in the short term. Otherwise, the price is likely to head towards $550 again and fluctuate within the triangle formation range. This movement should be carefully monitored as it approaches the pattern’s boundary levels.
SOL Completes the Double Top Pattern
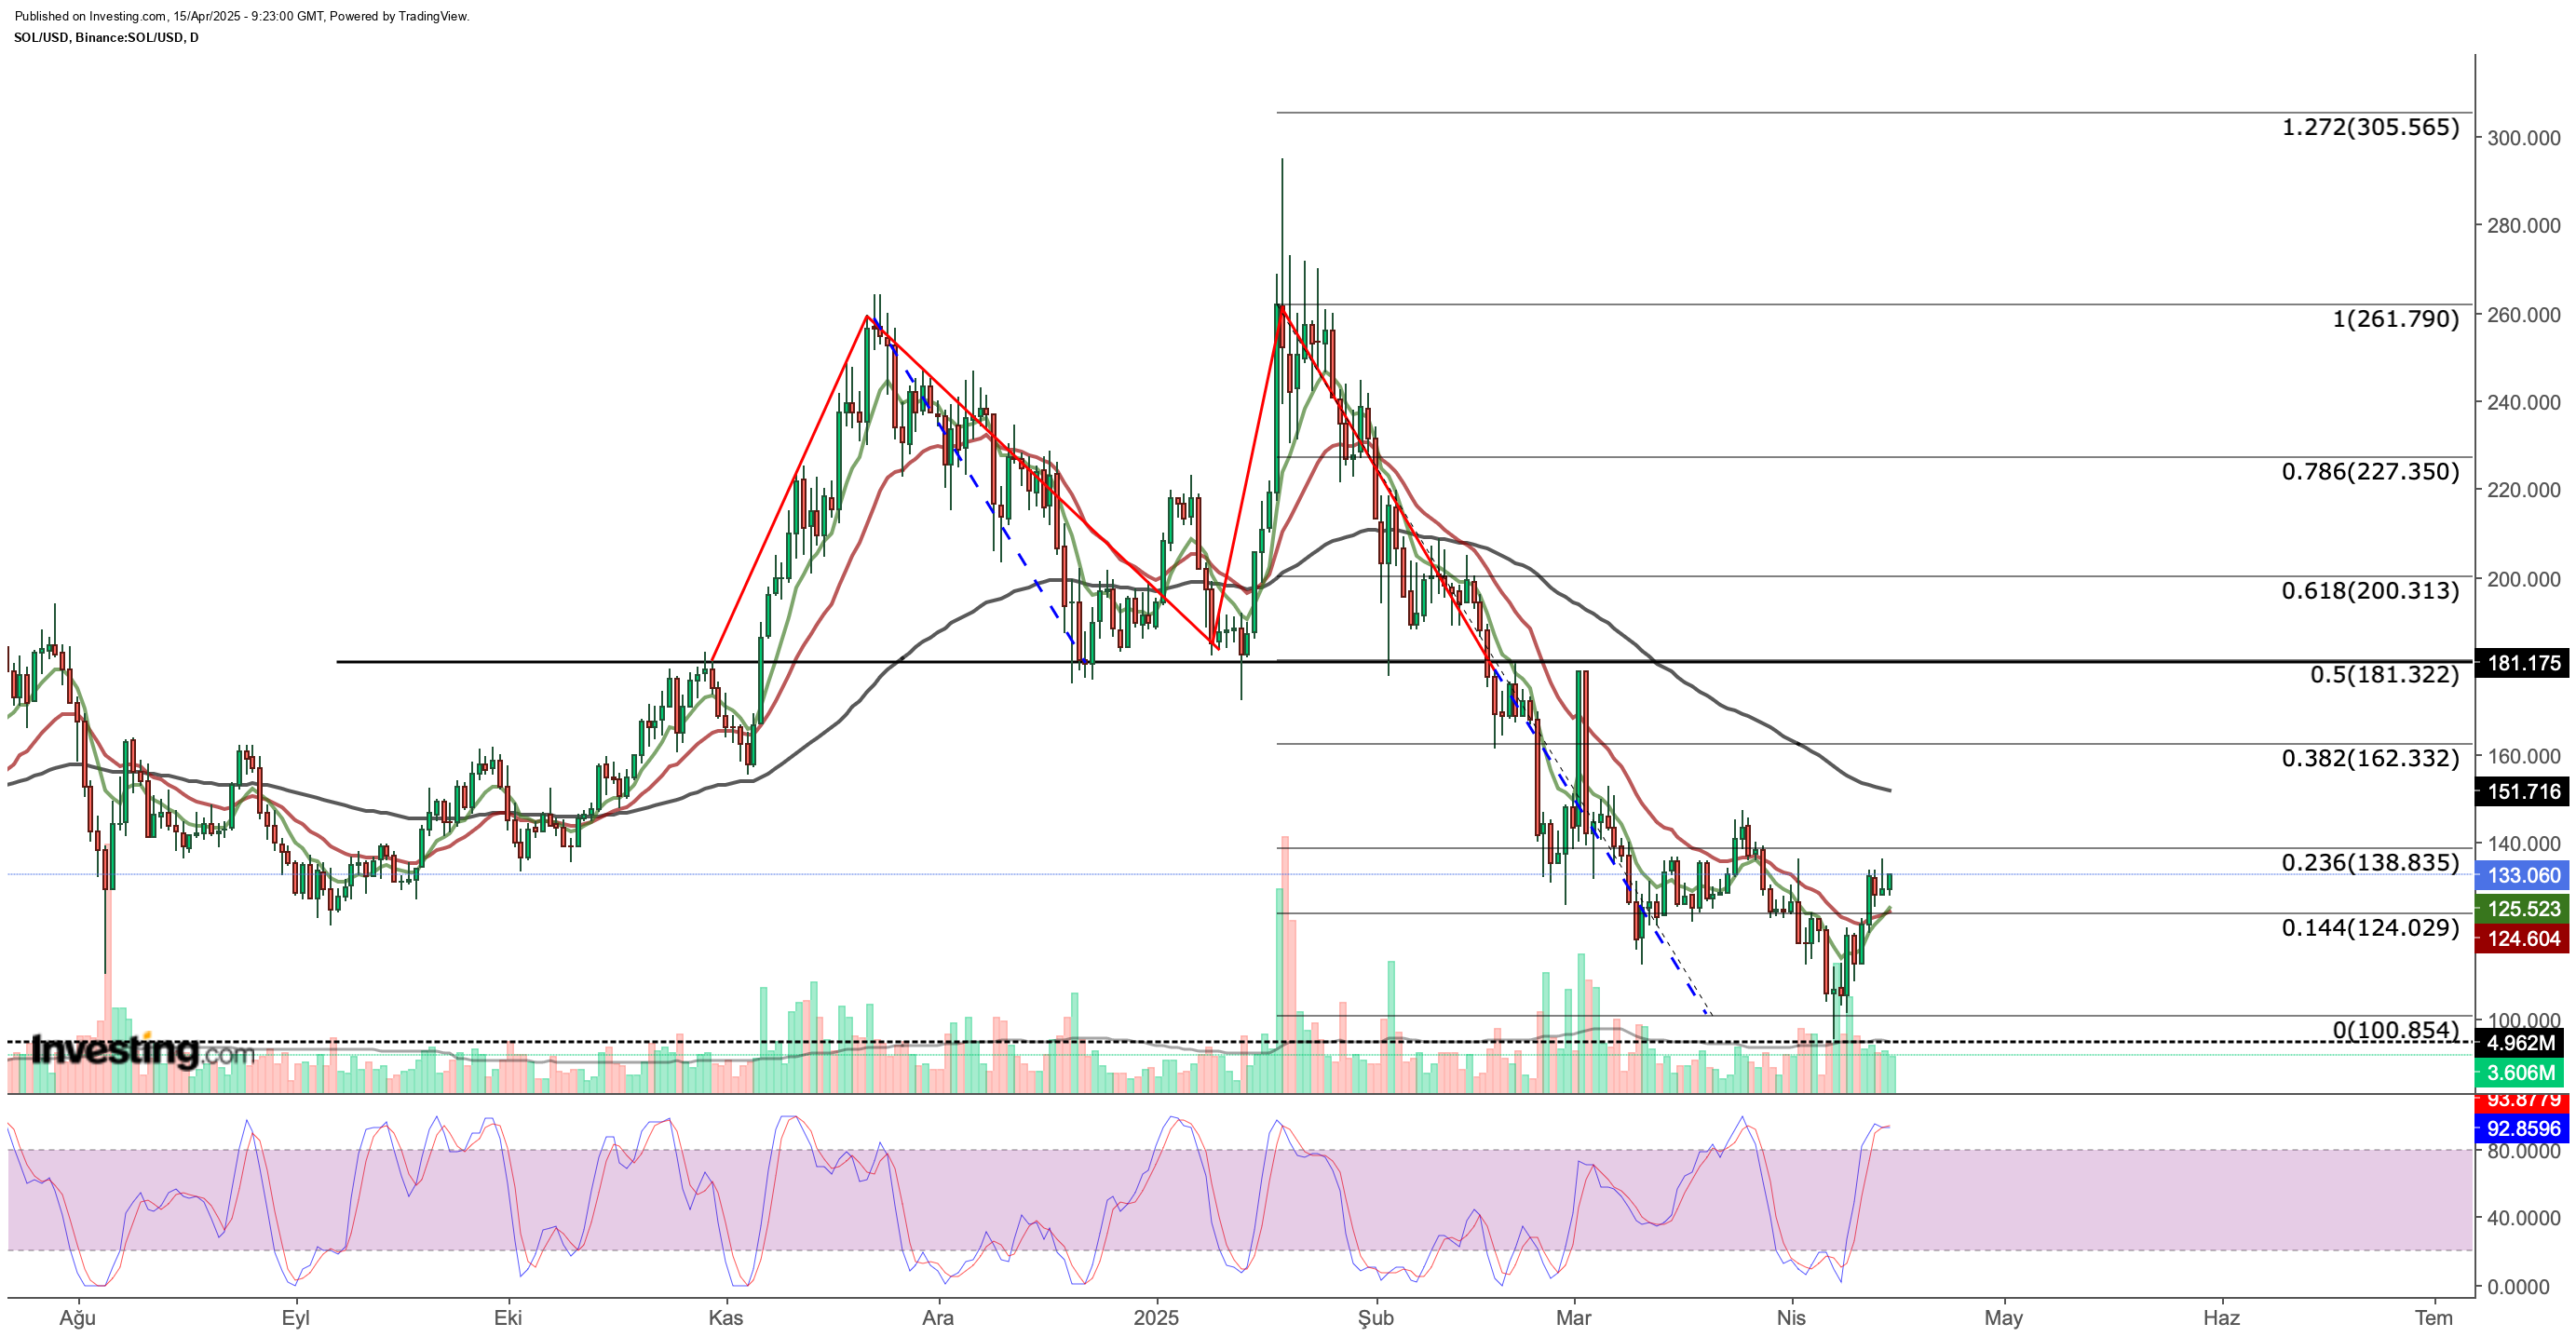
 SOL completed the $260 double top pattern it formed in November and January, falling to $100 in February. In this process, the neckline at $ 180 was broken and the target fell to the levels required by the pattern.
While the recovery process started with reaction purchases from $ 100, the cryptocurrency finally gave a signal of strength by breaking the $ 125 resistance. This level is now being monitored as the closest support. Above, the $140 level stands out as a critical resistance zone.
If $140 is exceeded, the $160-180-200 levels could be potential targets. However, if the $ 125 support is broken, there will be a risk of sagging below $ 100.
****
Be sure to check out InvestingPro to stay in sync with the market trend and what it means for your trading. Whether you’re a novice investor or a seasoned trader, leveraging InvestingPro can unlock a world of investment opportunities while minimizing risks amid the challenging market backdrop.
Subscribe now and instantly unlock access to several market-beating features, including:
- ProPicks AI: AI-selected stock winners with proven track record.
- InvestingPro Fair Value: Instantly find out if a stock is underpriced or overvalued.
- Advanced Stock Screener: Search for the best stocks based on hundreds of selected filters, and criteria.
- Top Ideas: See what stocks billionaire investors such as Warren Buffett, Michael Burry, and George Soros are buying.

Disclaimer: This article is written for informational purposes only. It is not intended to encourage the purchase of assets in any way, nor does it constitute a solicitation, offer, recommendation or suggestion to invest. I would like to remind you that all assets are evaluated from multiple perspectives and are highly risky, so any investment decision and the associated risk belongs to the investor. We also do not provide any investment advisory services.


