It was supposed to be the year of commodity bulls, with the World Bank to Goldman Sachs predicting runaway demand in nearly everything from oil to metals and grains. Instead, it’s turning out to be the year when commodity bears pulled off the biggest upset in oil and left deep losses that could take long to fix almost everywhere else in the sector.
Raw materials futures standing tall after the carnage of 2018 are few and far between. The biggest winners are some of the smallest markets.

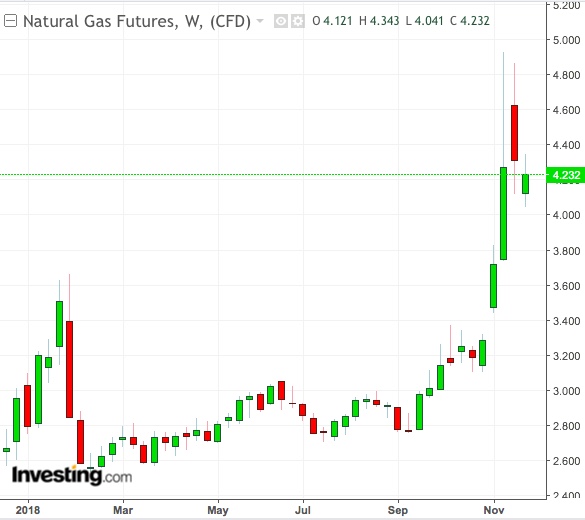
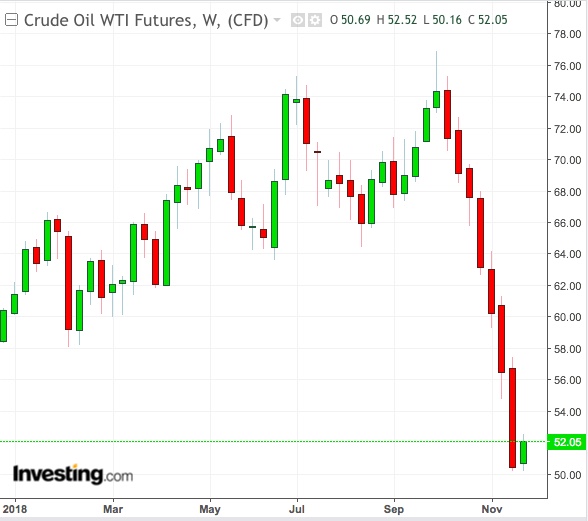
Natural gas, which receives less than two-thirds of the investor money that flows into crude oil, sealed the year’s largest gains—a whopping 40 percent surge. US crude, in comparison, is down 35 percent. Oats are up 18 percent while just having three percent of the open interest in soybeans, which are down nearly 10 percent year-to-date. Among precious metals, palladium has gained 7 percent while major rival gold, which is double in market size, is down 7 percent.
Falling Along With Equities
While each subsector of the commodity asset class—energy, metals and agriculture—is down, what surprises some market watchers is the near breakdown in the inverse relationship between commodities and equities. The 21-component Bloomberg Commodity Index is down 8 percent while Wall Street’s broadest stock index, the Dow Jones Industrial Average, is struggling to show a gain too.
Typically, commodities offer investors the opportunity for diversification, meaning they should rally when stocks are down. The Dollar Index, another contrarian bet to commodities, has performed to expectations, however, rising 6 percent on the year.
So, how did an asset class that began the year with such promise—Goldman said just before 2018 started that the backdrop for commodities demand was “even stronger than a year ago, with robust and synchronous global growth clearly evident"—crash and burn this way?
Trade War Started It All
It all started with the dollar rally forerunning the US-China trade war in April, before the tariff battle between the two countries itself started eating into demand for metals and grains—two of China’s biggest imports from the United States. Even then, oil prices continued to rally for nearly five months through October, reaching four-year highs, on US President Donald Trump’s threats to bring Iranian crude exports to zero.
Then, as aggressively as the year began for commodity bulls, it started reversing after the US sanctions on Tehran oil shipments turned out to be softer than thought. US crude production also reached all-time highs alongside Saudi and Russian output.
Simultaneously, the murder of Saudi journalist Jamal Khashoggi and the suspicion that it was state-engineered put the Saudis and their OPEC cartel at the mercy of Trump, who’s since been pressuring Riyadh to keep its oil production high and prices low in order to avoid US sanctions for the killing.
Oil’s Weakness Becomes Commodities’ Weakness

The result: The most prolonged bear market for oil that’s now weighing across the raw materials complex.
Goldman Sachs), in a note this week, said the current weakness of commodities was remarkable considering there was no recession in play and the global economy was due to grow 3.5 percent in 2019. While the tame US sanctions on Iran might have been the catalyst for the plunge in oil, it wasn’t the reason for its continued selloff, the Wall Street bank said, adding:
“We believe the answer lies in the lack of discretionary risk capital devoted to commodity markets. Without discretionary traders, systematic traders become a far larger share of the market and are having an outsized influence on commodity prices.”
Blame The Machine, Not The Man
These systematic traders were not just traders but often algorithms—or machines programmed to execute trades like humans, but typically without consideration for fundamentals.
Such “algos”, Goldman said,
“respond to price patterns or perceived risk premia, which become more important than spot fundamentals or even anticipatory views on such fundamentals. Historically, they have been focused on momentum and volatility selling strategies to create alpha.”
The group added:
“In the current environment, the short volatility strategies are being unwound, creating a spike in volatility, while the momentum strategies drive the market lower in oil. With no discretionary money to take the other side, market liquidity is drying up, which reinforces the momentum to the downside, causing commodities to decline more than equities, making them appear to price a more dire demand outlook.”
Current Environment 'Unsustainable'
The Wall Street bank, however, says the current botched environment for oil prices is unsustainable and predicts the situation will correct with an OPEC production cut when the cartel meets on December 6, regardless of Trump’s threats. Goldman also expects Trump and China leader Xi Jinping to agree to a trade deal at their summit at the G20 on Friday.
That aside, here are the year-to-date gains (rounded up) and technical outlooks for this year’s commodity leaders:
- Natural Gas: +44%, Buy
- Wheat: +18%, Sell
- Oats: +18%, Sell
- Cocoa: +13%, Strong Sell
- Palladium: +7, Strong Buy
- Corn: +5, Neutral
- Orange Juice: +3, Neutral
- Feeder Cattle: + 2, Strong Sell
