DXY is a moon rocket:
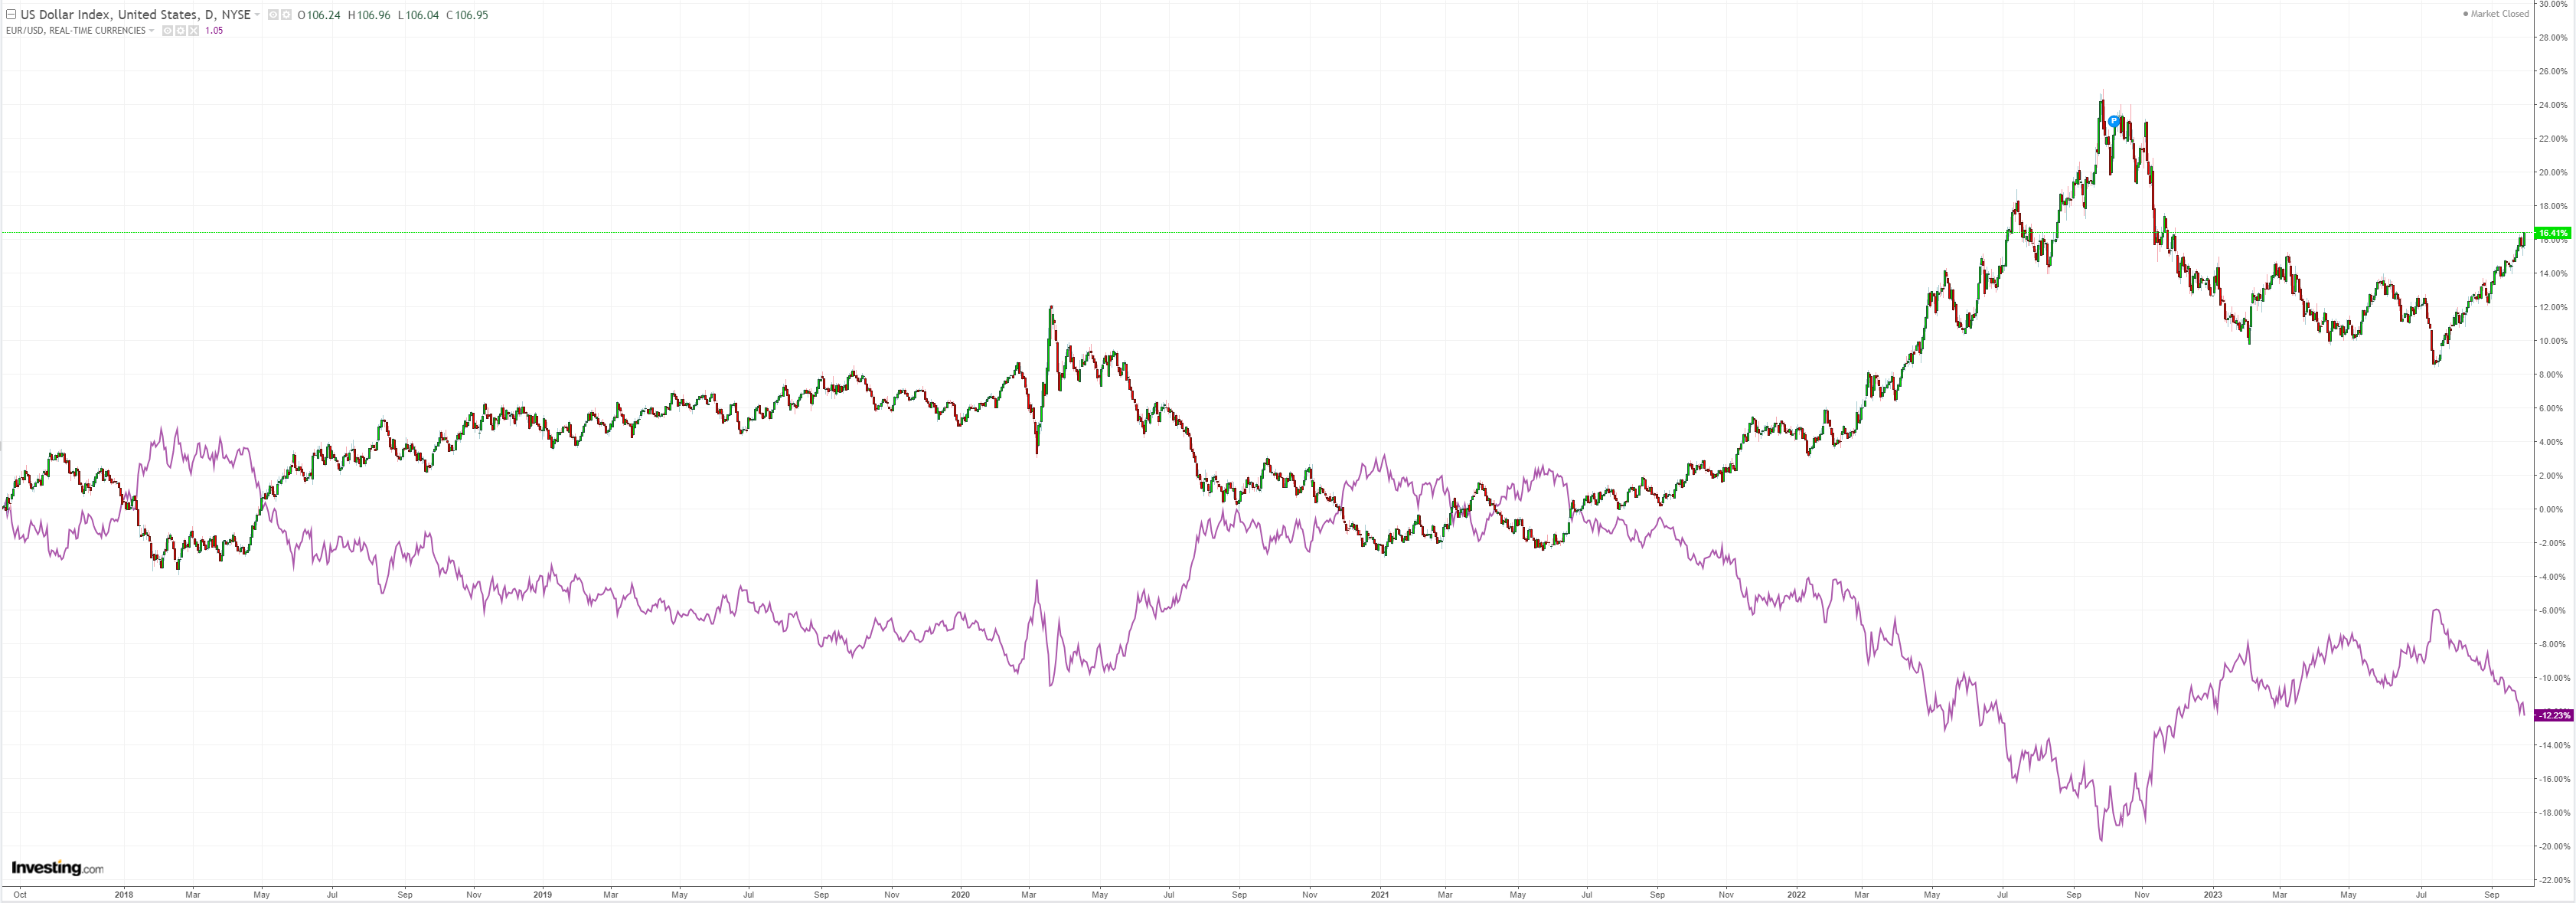
AUD was smashed back to the lows:
CNY is not free-floating:

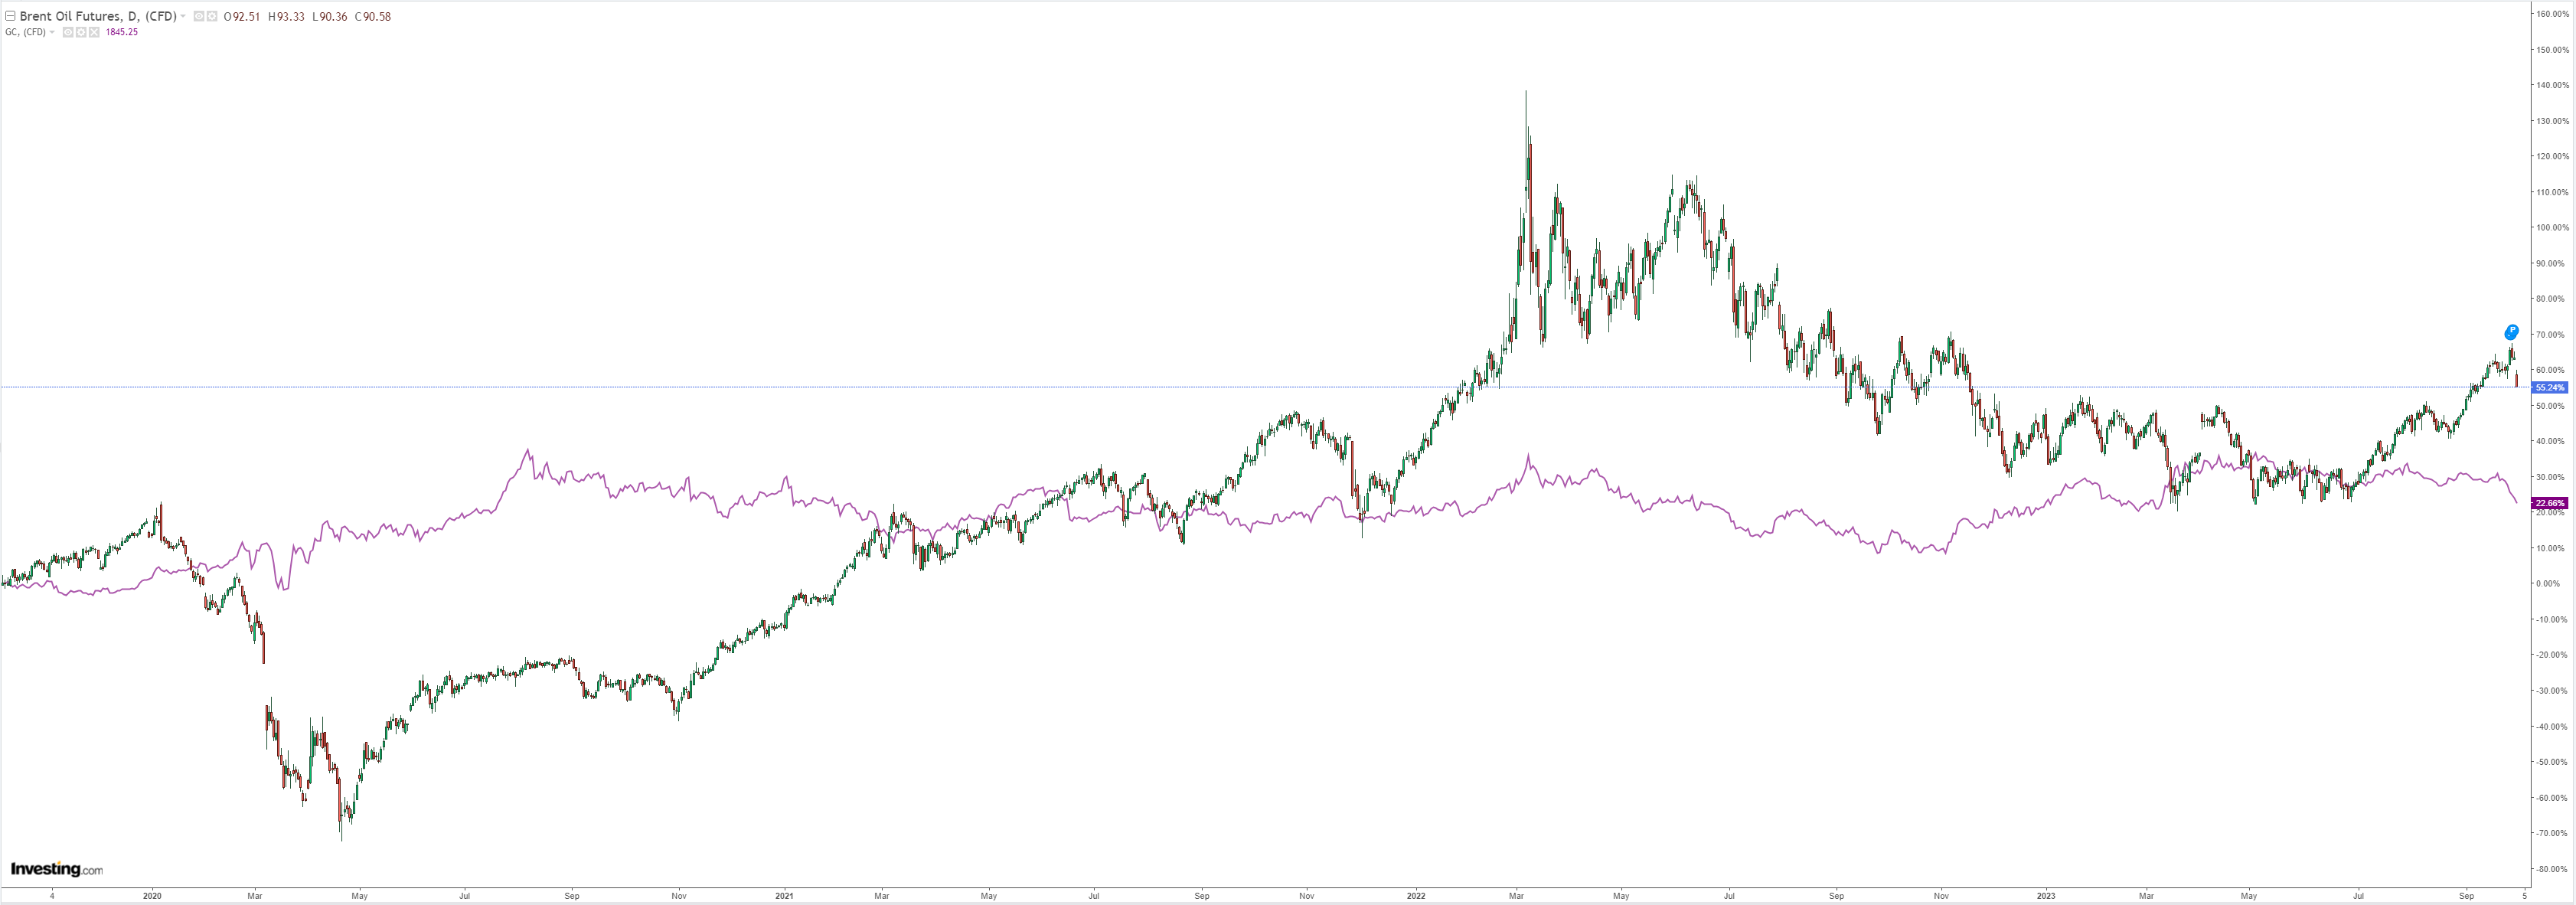
The oil lomg was crushed. Woe is gold:
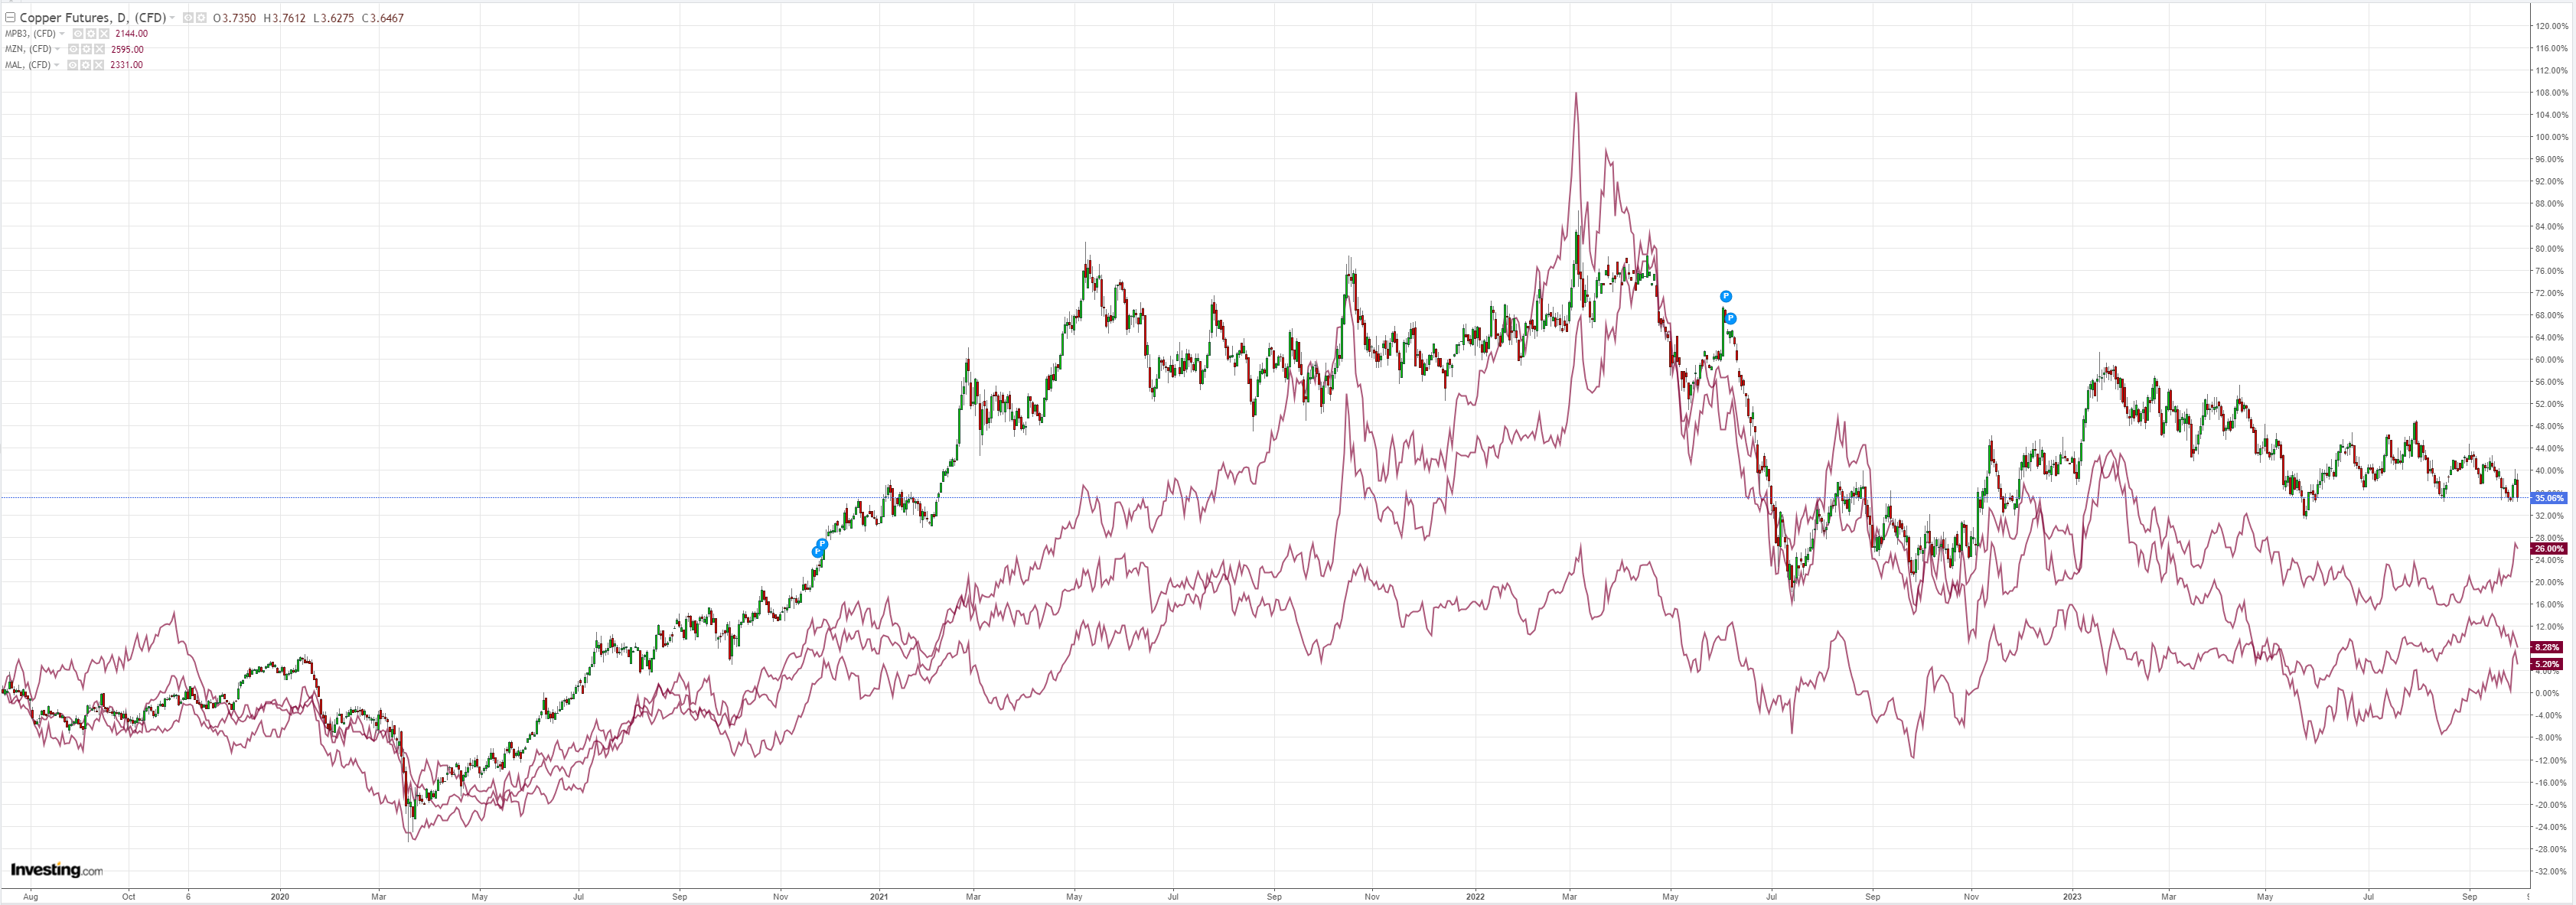
Dirt washed away:
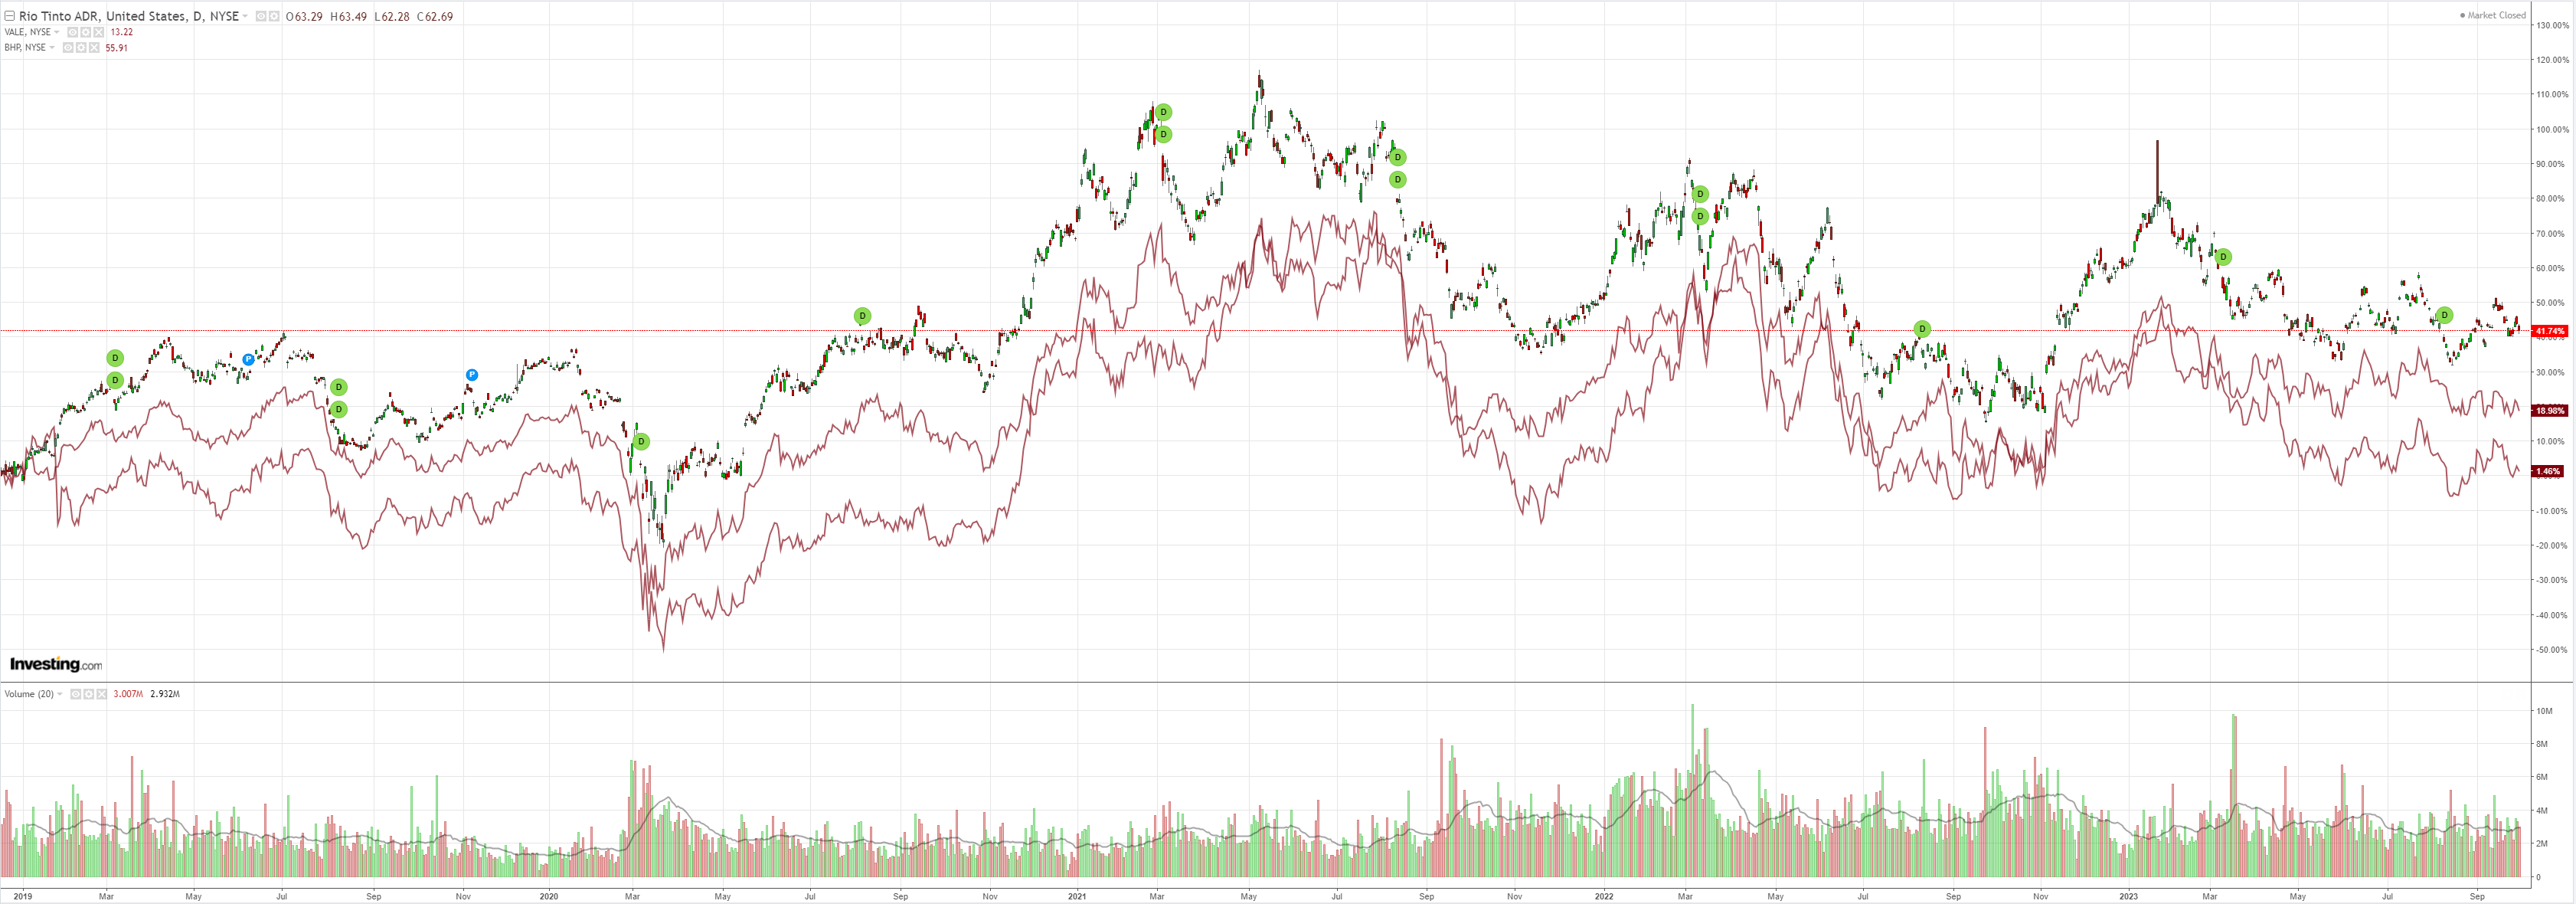
Big miners flushed:
EM is at the low of the range:

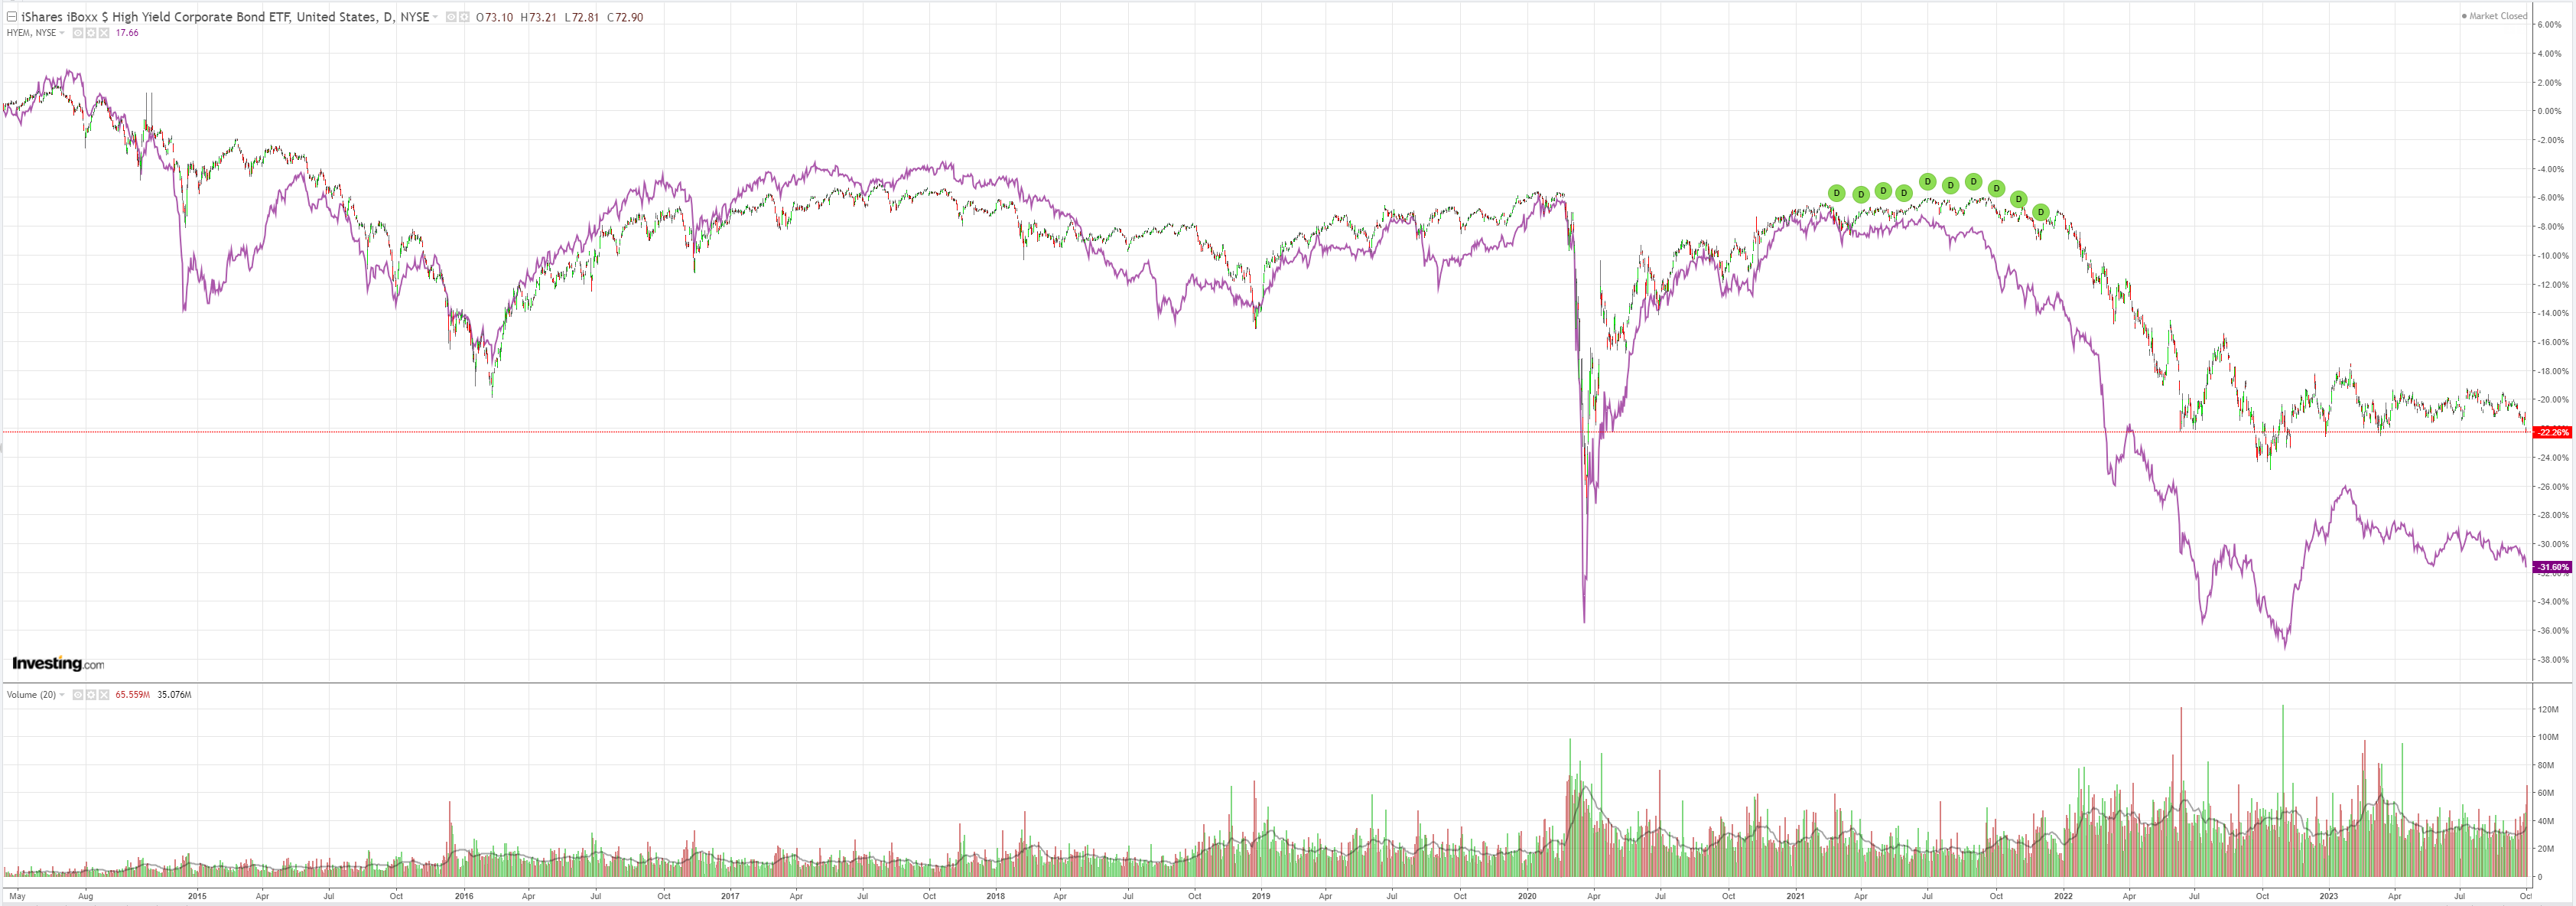
Junk broke. Stocks beware:
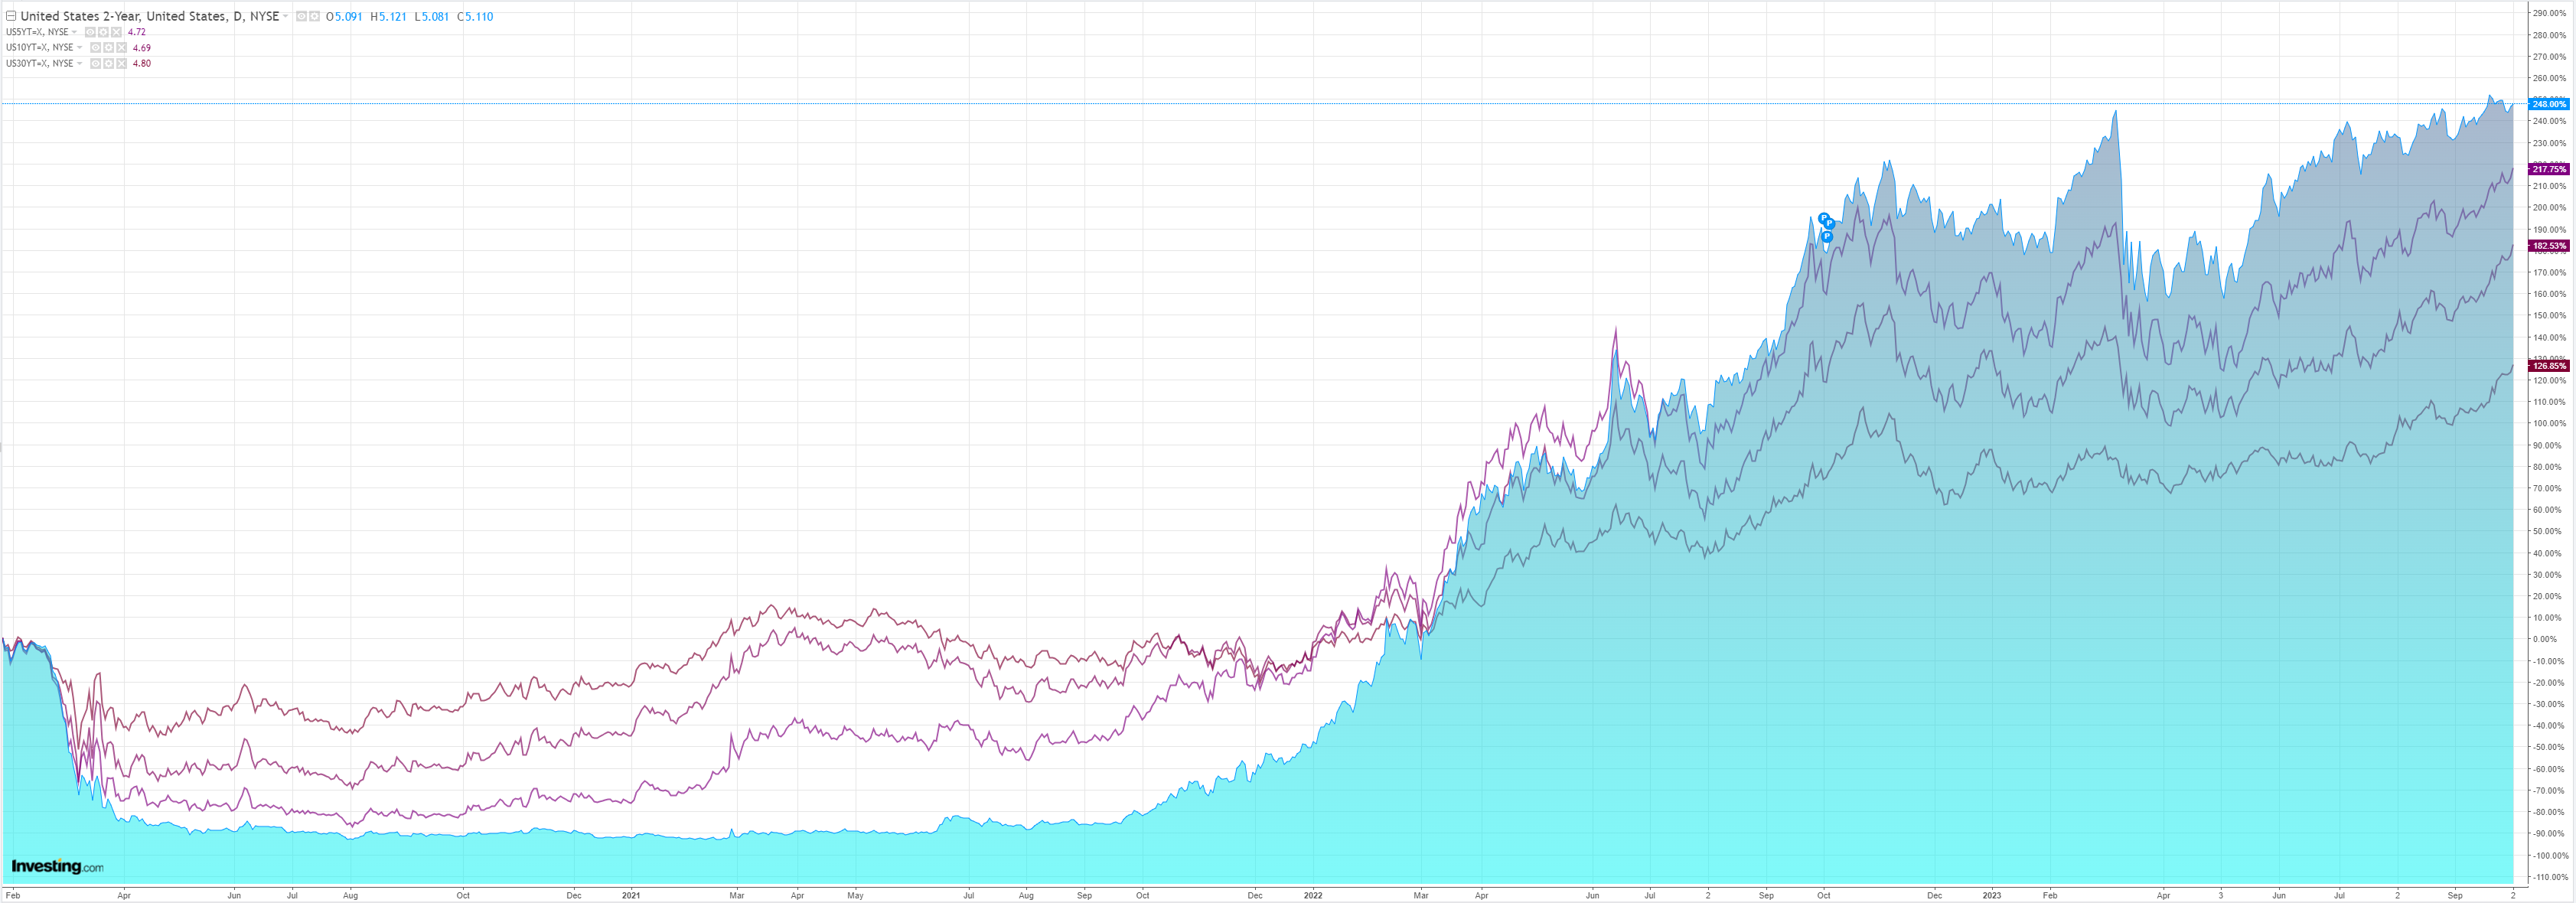
As the bull steepening runs wild:
OVersold stocks held up OK, but not for long under this heat:
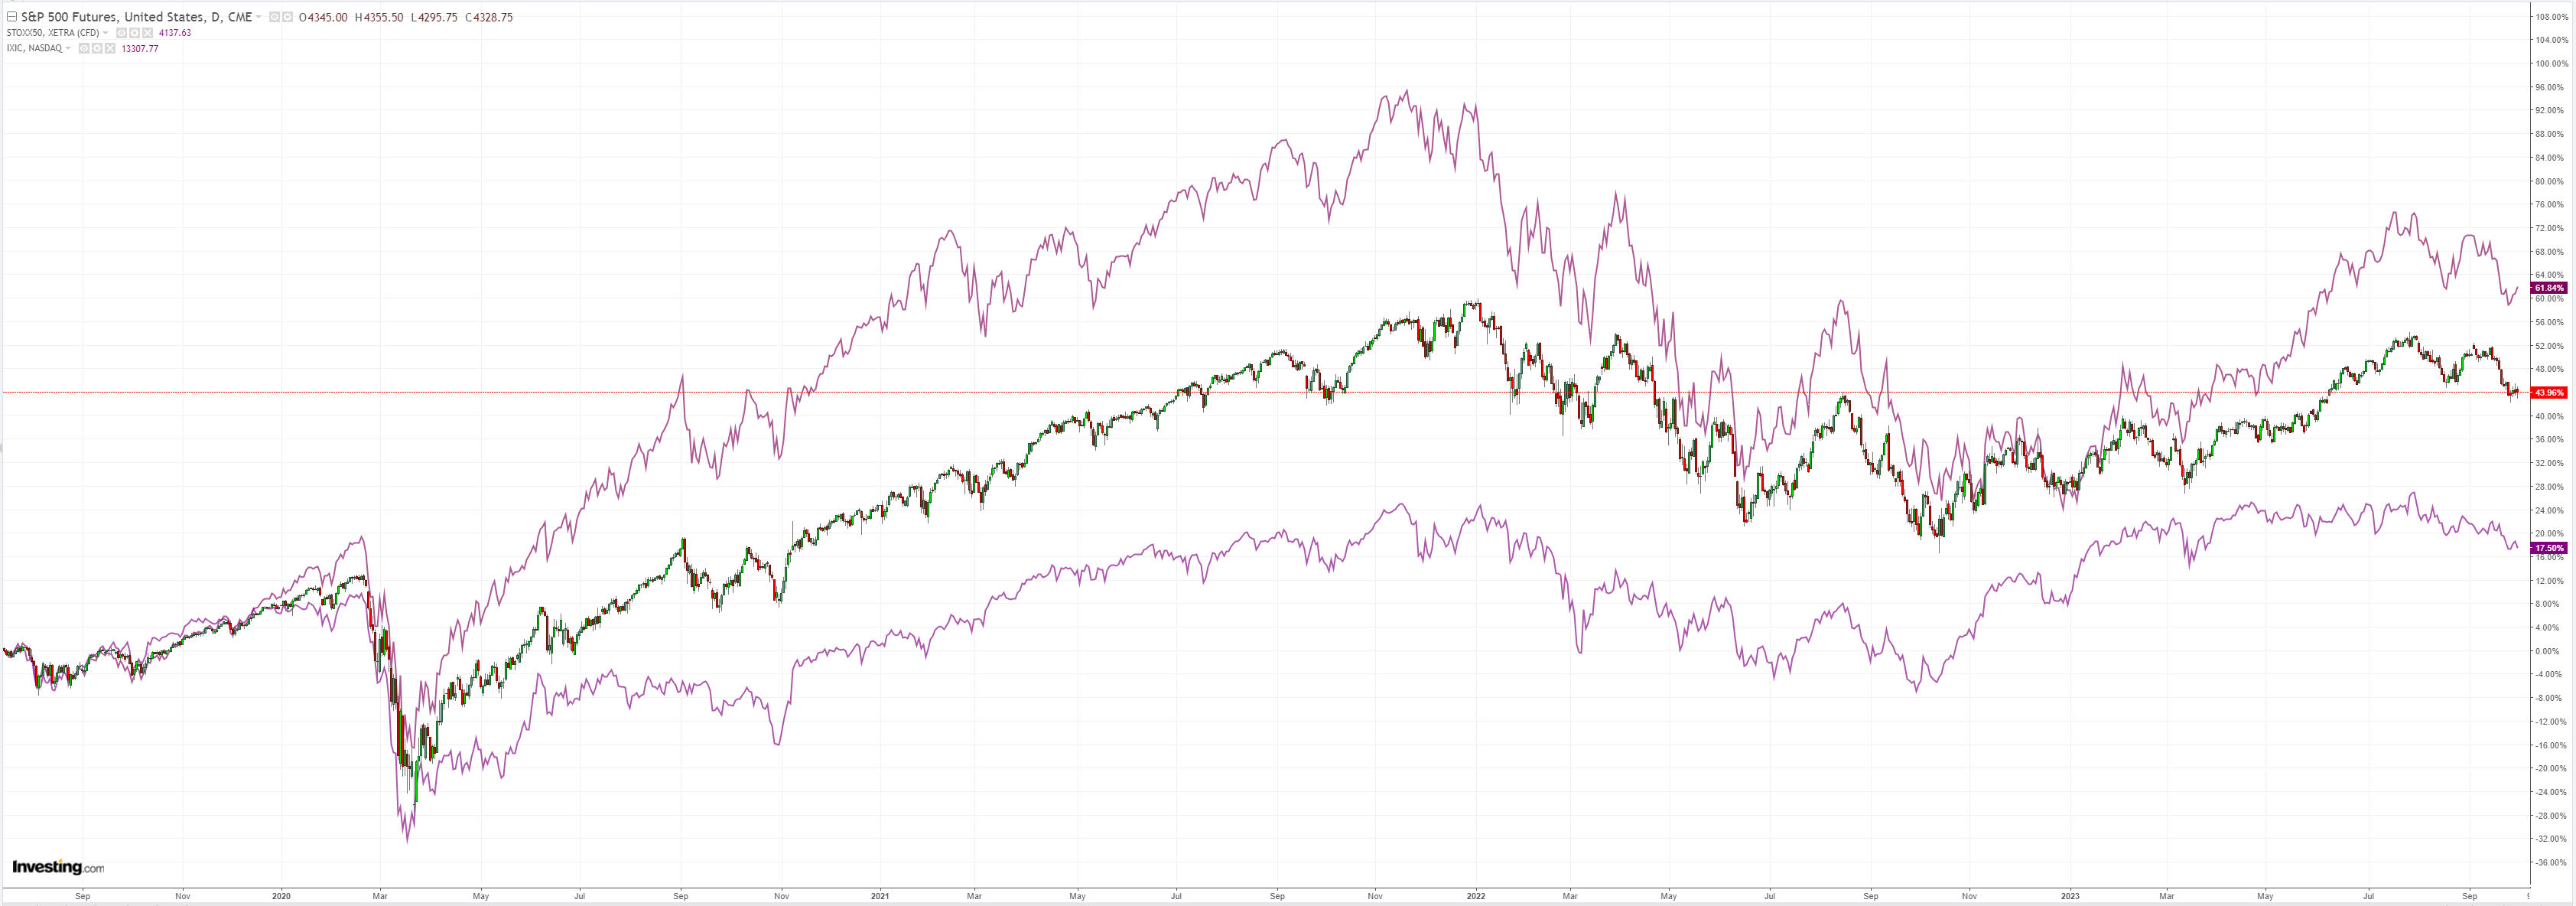
The ISM drove an extended US assets bid for another leg higher:
“The Manufacturing PMI® registered 49 percent in September, 1.4 percentage points higher than the 47.6 percent recorded in August. The overall economy expanded weakly after nine months of contraction following a 30-month period of expansion. (A Manufacturing PMI® above 48.7 percent, over a period of time, generally indicates an expansion of the overall economy.) The New Orders Index remained in contraction territory at 49.2 percent, 2.4 percentage points higher than the figure of 46.8 percent recorded in August. The Production Index reading of 52.5 percent is a 2.5-percentage point increase compared to August’s figure of 50 percent. The Prices Index registered 43.8 percent, down 4.6 percentage points compared to the reading of 48.4 percent in August. The Backlog of Orders Index registered 42.4 percent, 1.7 percentage points lower than the August reading of 44.1 percent. The Employment Index registered 51.2 percent, up 2.7 percentage points from the 48.5 percent reported in August.

The entire yield backup and associated moves are becoming extreme. BofA:
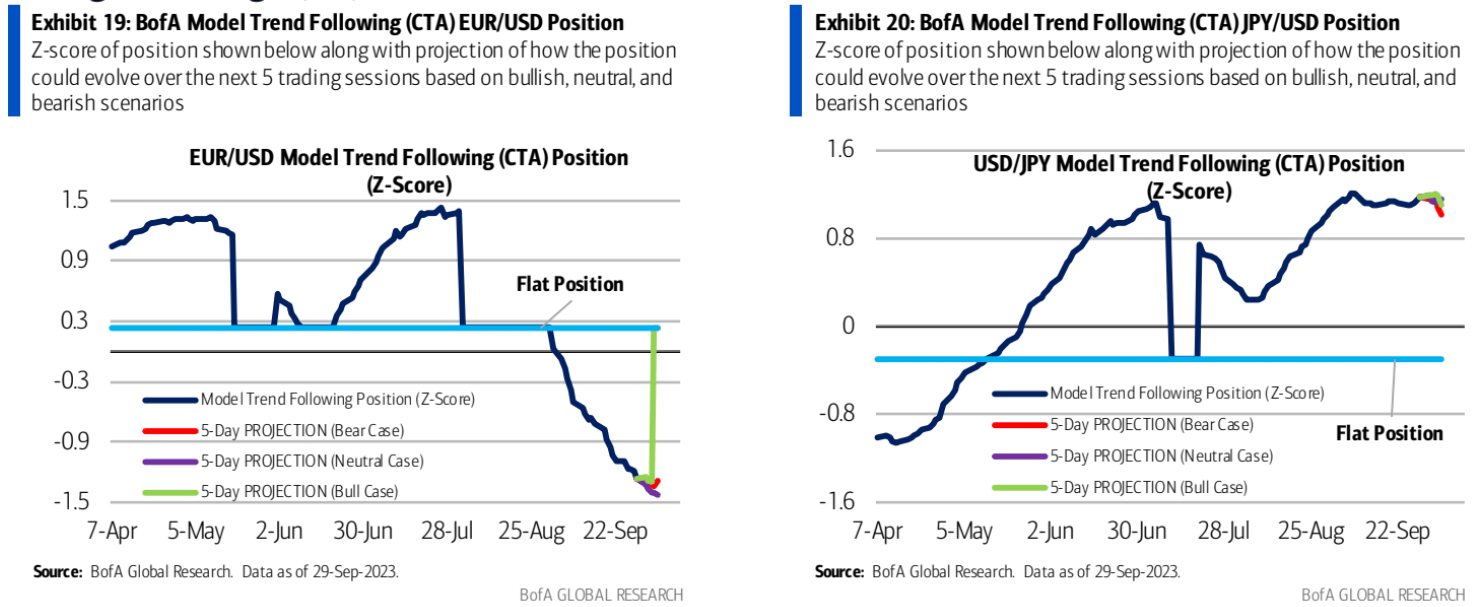
Our CTA model is a seller of equities near-term
Our CTA model still has longs in the S&P 500 and NASDAQ-100 but both are subject to unwinds next week. The S&P 500long looks to nearly flatten in most price paths next week, but the NASDAQ-100 long looks to remain partly intact even after expected selling next week. Our model is short Russell 2000 and that position is continuing to grow rapidly in size. In Europe positioning is short EURO STOXX 50 but with further selling on the lighter side next week. In Japan, our model has a median level long in the Nikkei 225 with the position potentially increasing in size next week.
Trend followers remain very short bonds
Echoing comments from last week, in fixed income we track CTA positions in 10-year US Treasury Bond, Bund, and Korean Treasury Bond futures and in each market positioning is stretched short. Given how wide the risk is, stop losses could be more impactful in the case yields give back some of their recent rises. In Exhibit 1 we list stop loss triggers for each market.
Model CTA very long Oil; Gold short increasing
Our model CTA’s Oil long is at its largest levels since Oct-21 and with positioning stretched a reversal leaves the risk of a full unwind/stop loss. For the next week, 87.6 on CLA futures would trigger our model’s stop loss. Our model’s Gold short is rapidly increasing in size with selling expected to continue next week. And for the second week in a row, the Soybeans and Soybean Oil longs are expected to see unwinds.
Long USD positions stretched and setting up stop losses
“How’s it going to end?” No, not The Truman Show, but the now eleven-week winning streak in the US dollar. CTAs are now likely quite stretched short in EUR, GBP, JPY, AUD, and CAD. Correspondingly, reversals leave trend followers at risk of quicker losses and in Exhibit 1 we note triggers in each of those markets. Of the pairs mentioned, the GBP short has the most room to increase in size, according to our model.
DXY is so rampant that not even oil can keep pace. The M7 is a crazy bid given a lurching global economy is next and currency shock is underway to earnings. Bonds are uninvestible. Junk is in free fall.
We’re reaching the end game for the business cycle again. The FCI tightening that is underway will blow something up in due course.
