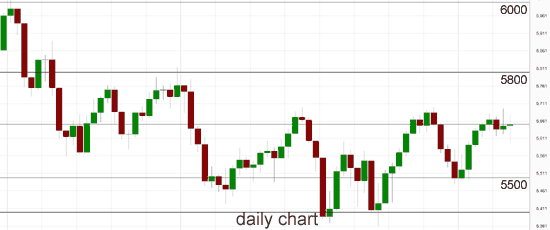
Australia 200 – Thursday 6 August 2015
Throughout last week, the ASX 200 index enjoyed a solid rally back up to the resistance area around 5650 and 5700 after bouncing off support at 5500, however it has rolled over in the last couple of days feeling the selling pressure. It remains right at the resistance level around 5650 and continues to apply pressure. Several weeks ago the ASX200 enjoyed a solid resurgence back up from support at 5400 to a new three week high above 5650, however a couple of weeks ago it met resistance around 5650 and was forced lower. It has since then enjoyed some solid support from 5500 which has held it up well allowing it to rally higher again back towards the resistance at 5650 over the last week. Over the last six weeks or so the index has been able to find some much needed support around 5400 however with lower peaks over the same period. During this time the 5400 level has been severely tested but it has held up very well.
Throughout the last month or so it has fallen sharply a number of times yet enjoyed solid support from 5500, however this level has now given way. In the second half of May the medium term down trend in the ASX 200 had reversed however just as quickly it has taken out the lows around 5550 and moved lower to its lowest levels in five months. The 5500 level has been solid in the last few weeks and provided reasonable support to the index however too much bearish sentiment broke through this level. A little higher up at 5800, this level remains large and continues to apply downwards pressure on the index, as this has been a significant level for the index throughout this year. It will be interesting to see whether the index can garner enough support from the short term support level around 5500 which has propped the index up over the last week or so.
Back in early May the Australia 200 index declined sharply from highs around the key 6000 level and whilst it paused a little around 5800 and enjoyed some support, it continued to decline down to a three month low around 5550. Even if it was able to rally higher and move back through the key 5800 level, the index will rejoin the congestion range between 5800 and 6000 and likely find it difficult to move through there quickly. Accordingly the 6000 level which was spoken about at length for most of this year is now a distant level and is probably some time away from being seen again.

Australia 200 August 6 at 00:20 GMT 5652 H: 5679 L: 5599
Australia 200 Technical
| S3 | S2 | S1 | R1 | R2 | R3 |
| 5500 | 5400 | — | 5650 | 5800 | 6000 |
During the early hours of the Asian trading session on Thursday, the Australian 200 index will be trying to rally and get back through the resistance at 5650.
Further levels in both directions:
• Below: 5500 and 5400.
• Above: 5650, 5800 and 6000.
Economic Releases
- 01:30 AU Employment (Jul)
- 01:30 AU Unemployment (Jul)
- 05:00 JP Leading indicator (Prelim.) (Jun)
- 08:30 UK Industrial/ Manufacturing Production (Jun)
- 11:00 UK BoE MPC – APF Total (Aug)
- 11:00 UK BoE MPC – Base Rate (9/7/2015)
- 11:00 UK BoE Monetary Policy Committee meeting and rate decision
- 11:00 UK BoE Releases Quarterly Inflation Report
- 11:00 UK BoE MPC minutes released
- 12:30 US Initial Claims (1/8/2015)
- 14:00 UK NIESR GDP Est. (Jul)
