- Small caps have had a very strong June, outperforming the S&P 500
- One way to invest in small caps is through dedicated ETFs
- Another way is to buy high-flying small caps that we will discuss in this article
- InvestingPro Summer Sale is on: Check out our massive discounts on subscription plans!
While the technology-focused Nasdaq and the Japanese Nikkei 225 have had all the attention due to their impressive rallies this year, it's important to redirect our focus towards another category of stocks that have been performing exceptionally well, particularly in recent times.
Enter the realm of small-cap companies. These companies, with market capitalizations typically ranging between $300 million and $2 billion in the United States, have demonstrated strong performance relative to the broader market.
In Europe, the threshold for defining a company as a small cap would be €3 billion. Beyond these levels, we find mid-cap and large-cap companies.
In the United States, small companies constitute over 60% of the market, while in Europe, their representation is slightly above 50%. This highlights the significance of the small-cap sector, making it an area worth monitoring.
Various small-cap indexes exist to track the performance of these companies. In Europe, small caps can be tracked by the EURO STOXX Small Cap, while in the United States by the S&P 600 Small Cap and the US Small Cap 2000.
Investing in small caps can be accomplished through specialized investment vehicles such as mutual funds and ETFs. Here are a few examples:
-
Invesco S&P SmallCap 600 Pure Value ETF (NYSE:RZV)
-
SPDR S&P Emerging Markets Small Cap ETF (NYSE:EWX)
- First Trust Developed Markets ex-US Small Cap AlphaDEX Fund (NASDAQ:FDTS)
- L&G Russell 2000 US Small Cap UCITS ETF USD Accumulate (LON:RTWO)
- SPDR® MSCI Europe Small Cap Value Weighted UCITS ETF EUR Acc (ETR:ZPRX)
A compelling illustration of the strength of small caps lies in the S&P 600 Small Cap ETF (NYSE:SLY) which significantly outperformed the S&P 500 in June. In fact, the majority of small-cap stocks have experienced notable growth this month.
Interestingly, the IFA U.S. Small Company index has delivered an impressive annual return of +11.1% since 1928, outperforming the +9.9% annualized gain of the S&P 500 over the same period.
Now, let's examine a selection of highly promising small-cap stocks that are experiencing robust growth this June. To conduct our analysis, we will leverage InvestingPro, which provides us with comprehensive data and valuable insights.
1. Caleres
Caleres (NYSE:CAL) is a prominent American footwear company headquartered in Clayton, Missouri. With a rich history dating back to its establishment in 1878 as Bryan, Brown & Company in St. Louis, the company has undergone several name changes throughout its existence. Caleres currently owns and operates numerous footwear brands, positioning itself as a key player in the industry.
Source: InvestingPro
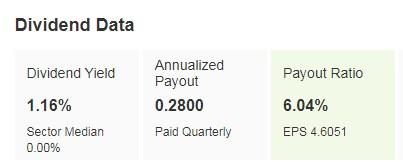
It pays an annual dividend of $0.28 per share ($0.07 each quarter). The yield is +1.16%.
Source: InvestingPro
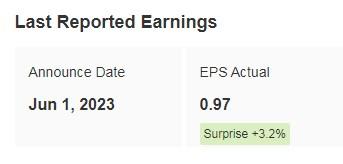
Caleres is scheduled to present its financial results on September 5. Notably, the company's previous earnings, released on June 1, EPS surpassed expectations.

Source: InvestingPro
InvestingPro models give it a potential of $33.45.

Source: InvestingPro
The stock is up +34.77% in June.

2. Quanex Building Products Corporation
Quanex Building Products (NYSE:NX) is a global manufacturing company serving manufacturers in the cabinetry, solar, refrigeration, and outdoor products markets.

Source: InvestingPro
Quanex Building Products is another company that pays a dividend of $0.32 per year, with a quarterly distribution of $0.08. This results in a dividend yield of approximately +1.24% based on the current stock price.
The next dividend from Quanex Building Products is scheduled to be distributed on June 30.
Source: InvestingPro
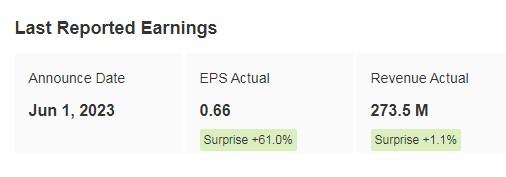
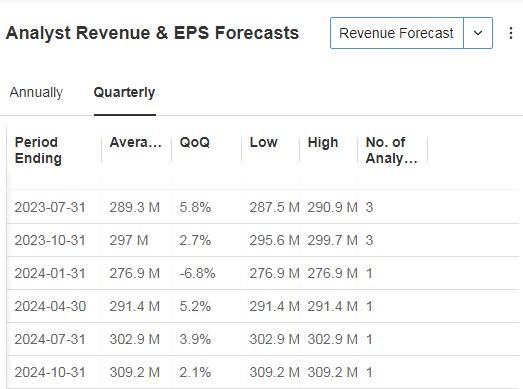
Quanex Building Products is set to announce its financial results on September 7. In the previous release on June 1, the company reported positive results that exceeded market expectations.
Source: InvestingPro
The stock is up +21.41% in June.

Source: InvestingPro

Source: InvestingPro
InvestingPro models give it a potential of $32.58.

3. CIRCOR International
CIRCOR International, Inc. (NYSE:CIR) is a renowned global supplier of products and services catering to industrial, aerospace, and defense markets. It boasts a diverse portfolio of products from top brands, which it distributes through various partners to over 14,000 customers across 100 countries. With a global presence, its headquarters are located in Burlington, Massachusetts.
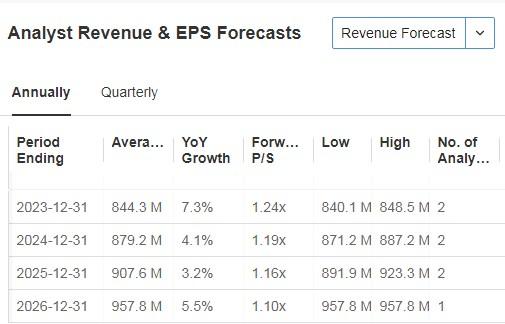
The company is expected to release its financial results on August 10. The market has raised revenue expectations for the quarter, indicating anticipated strong performance. Furthermore, the company forecasts a more than +13% increase in earnings for the year, projecting earnings per share of $2.07. Over the next five fiscal years, net income growth is predicted to average around +37%.
Source: InvestingPro
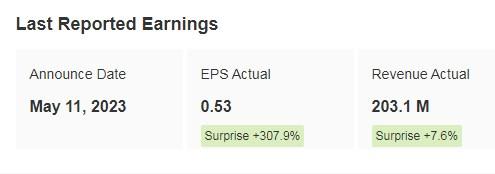
The previous earnings report was on May 11, and they far exceeded market forecasts.
Source: InvestingPro
BlackRock is the top equity holder, and Vanguard is the third.

Source: InvestingPro
CIRCOR International's stock has demonstrated remarkable growth in recent times. In the month of June alone, its shares have surged by +77%, and over the past 12 months, they have soared by an impressive +239.87%.

4. Designer Brands
Designer Brands (NYSE:DBI) is a company that specializes in designing, producing, and retailing footwear and accessories brands. With over 1,000 distribution points, it offers a wide range of branded and designer footwear and accessories for both dress and casual sports occasions. The company's first store opened in 1991 in Dublin, Ohio, and it has since expanded to operate more than 500 stores across 44 states.
Source: InvestingPro

Source: InvestingPro
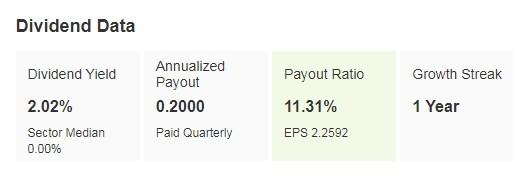
Distributes an annual dividend of $0.20 per share ($0.05 each quarter) with a yield of +2.02%.

Source: InvestingPro
Designer Brands has pursued an aggressive share repurchase strategy, resulting in repurchase yields of +19.6% over the past 12 months.
It reports results on August 29.

Source: InvestingPro
Its shares are up +52.64% in June.

Are you considering new stock additions to your portfolio or divesting from underperforming stocks? If you seek access to the finest market insights to optimize your investments, we recommend trying the InvestingPro professional tool for free for seven days.
Access first-hand market data, factors affecting stocks, and comprehensive analysis. Take advantage of this opportunity by visiting the link and unlocking the potential of InvestingPro to enhance your investment decisions.
And now, you can purchase the subscription at a fraction of the regular price. So, get ready to boost your investment strategy with our exclusive summer discounts!
As of 06/20/2023, InvestingPro is on sale!
Enjoy incredible discounts on our subscription plans:
- Monthly: Save 20% and get the flexibility of a month-to-month subscription.
- Annual: Save an amazing 50% and secure your financial future with a full year of InvestingPro at an unbeatable price.
- Bi-Annual (Web Special): Save an amazing 52% and maximize your profits with our exclusive web offer.
Don't miss this limited-time opportunity to access cutting-edge tools, real-time market analysis, and expert opinions.
Join InvestingPro today and unleash your investment potential. Hurry, the Summer Sale won't last forever!
Disclaimer: This article was written for informational purposes only; it does not constitute a solicitation, offer, advice, counsel, or recommendation to invest, nor is it intended to encourage the purchase of assets in any way.

