Risk free just got more lucrative
Last week, stocks delivered one of their most forgettable performances of 2023. The benchmark Australian stock index, the ASX200, was down just over one percent, but as can be seen from the table below, it fared better than many of its international counterparts.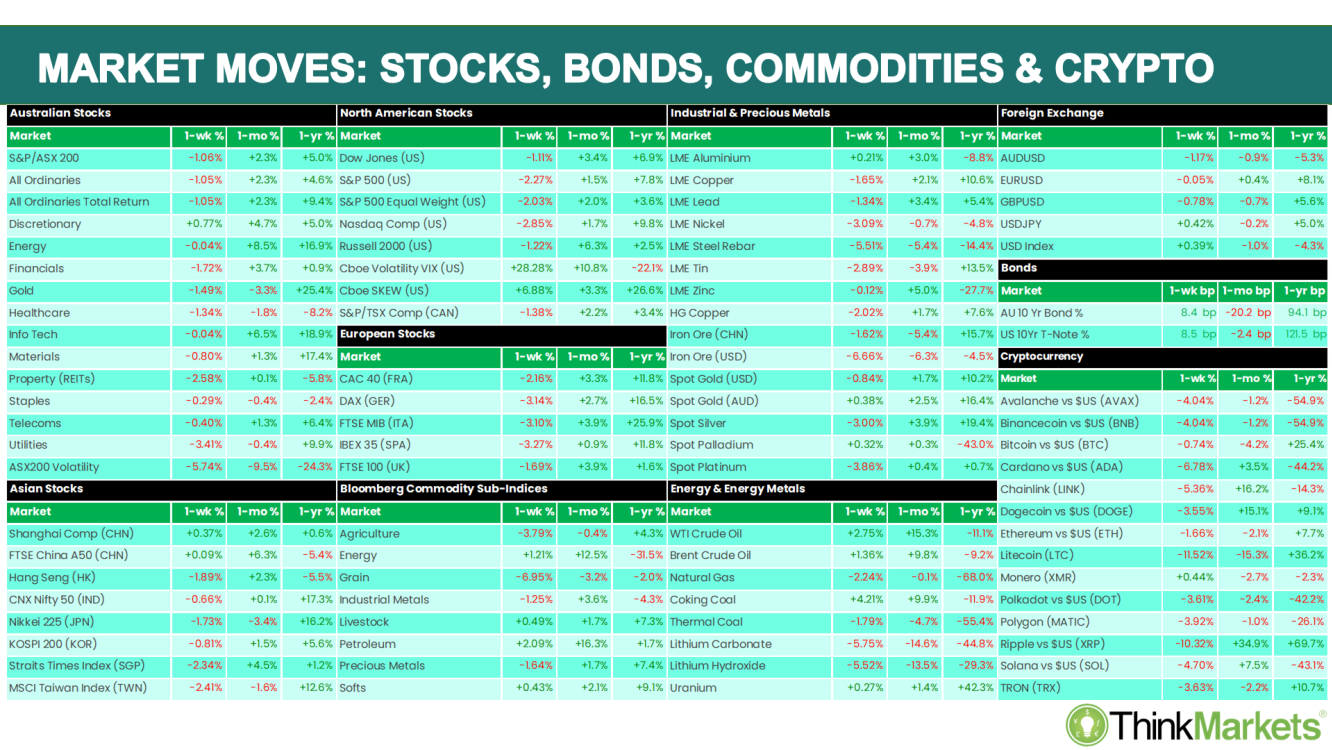
Interestingly, the ASX Property and Utilities sectors appeared to be singled out for some particularly harsh attention. When one considers the reason why stocks (and other risk-on assets) struggled last week, this makes plenty of sense. These sectors typically own long-duration assets funded predominantly via long-term debt obligations. Last week, we saw market rates earned on benchmark long-term debt assets spike, and therefore Property and Utilities companies are likely to face higher costs of funding.
Without a doubt, the key "bull market killer" item impacting risk assets last week was the rapid and large increase in yields of longer-term US Treasury bonds. Ordinarily the realm of the most conservative investors, that is, those looking for a reliable risk-free return in the long run, movements in the prices of long-term bonds all over the world sent shockwaves through the universe of everything else. Leading the charge higher was the yield on the US 30-year Treasury bond.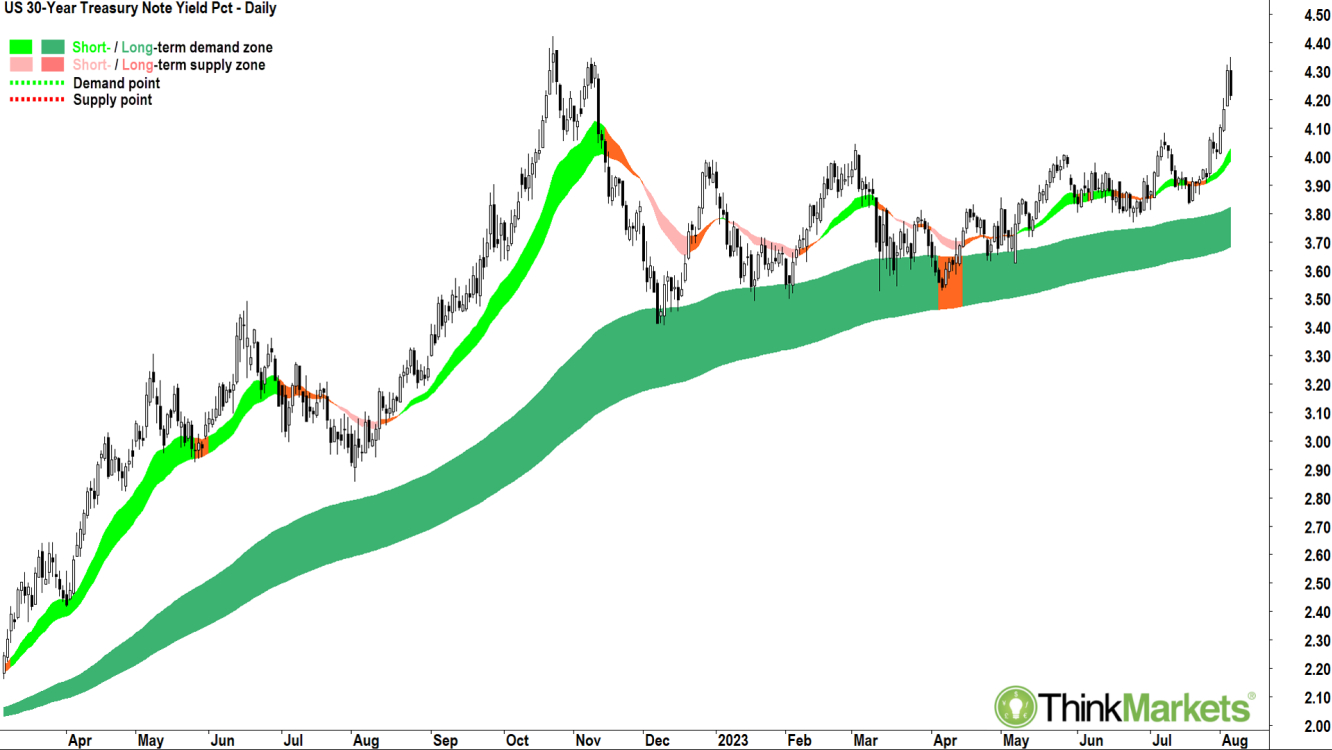
There are two major catalysts driving this move. Firstly, major financial ratings agency Fitch Ratings, downgraded its long-term default rating for the USA one notch to AA+ from AAA. Fitch cited the nation's recent debt ceiling conflict in Washington as the main reason undermining its confidence in US debt, noting "The repeated debt-limit political standoffs and last-minute resolutions have eroded confidence in fiscal management".
According to Fitch, this would likely lead to "expected fiscal deterioration" as well as a "growing general debt burden". Indeed, Fitch expects that burgeoning interest rate payments, growing Medicare costs, and a softening US economy which is likely to dampen tax revenues, will likely lead to a blowout in the US Governments fiscal situation.
Whilst most market participants have shaken off the Fitch downgrade as "telling us stuff we already knew", it came at a coincidentally unfortunate time for markets. On the same day as Fitch's announcement, the US Treasury announced it had increased its issuance target for the coming quarter to just over US$1trillion to plug the deterioration in the US Government's fiscal outlook. This includes some $103 billion of 3-year, 10-year, and 30-year bonds to be sold this week.
The oldest rule of economics is "greater supply usually leads to lower prices". We're clearly on the verge of a deluge of supply of US paper, and at a time where Fitch is pouring accelerant on the fire by undermining confidence in that paper. Keep in mind, lower bond prices equates to higher bond yields. The result last week was a spike from 4.01% to 4.36% in the yield on the 30-year T-Bond by Friday morning. The yield on this bond eventually settled at 4.22% by Friday's close, but was still up some 21 basis points for the week.
To put this into perspective, investors often fret about a Federal Reserve interest rate hike of 25 basis points. The market applied one all by itself last week. I won't go into the ramifications of higher interest rates because these are well known, but I do want to point out a couple of important implications of the current scenario.
Firstly, US 30-year Bonds are the ultimate long-term "risk-free" investment (US Treasury bonds are generally considered to be risk free because Uncle Sam always pays his bills!). If the yield on this bond is rising towards 4.5%, then this is a very attractive alternative to "risky" stocks which are yielding a paltry 1.52% based upon the current S&P500 dividend yield. This naturally puts pressure on share prices.
Secondly, US mortgage rates are usually set based upon the yield of the US 30-year Treasury Bond. As mortgage rates (and other key lending rates within the US economy) increase, there naturally will be less money available to many Americans to spend. As consumption is a major contributor to US GDP, this will likely have a negative impact on American corporate earnings. Weaker US economic growth, and higher borrowing costs across the globe in response to this week's bond market moves, mean extreme pressure on stock prices.
ASX earnings season kicks into gear
Bringing it back home. We find ourselves at the beginning of what is shaping as the most interesting and important earnings season since the pandemic. Companies have had time to adjust to supply chain chaos, spiking input prices, and tight labour markets. More recently, and this has typically not been the case since the dramatic stimulus measures delivered post-pandemic, the data points to a meaningful slowdown in consumer spending in the first half of 2023.
The norm, as in your typical C-grade company, probably has seen rising costs eat into margins as pricing power has been insufficient to recoup all costs. Worse, revenues are likely down on the back of a weakening consumer. A+ grade companies on the other hand have controlled their costs while simultaneously massaging prices higher to protect margins. Even better, these companies are still seeing robust demand from consumers, and therefore have achieved attractive revenue growth.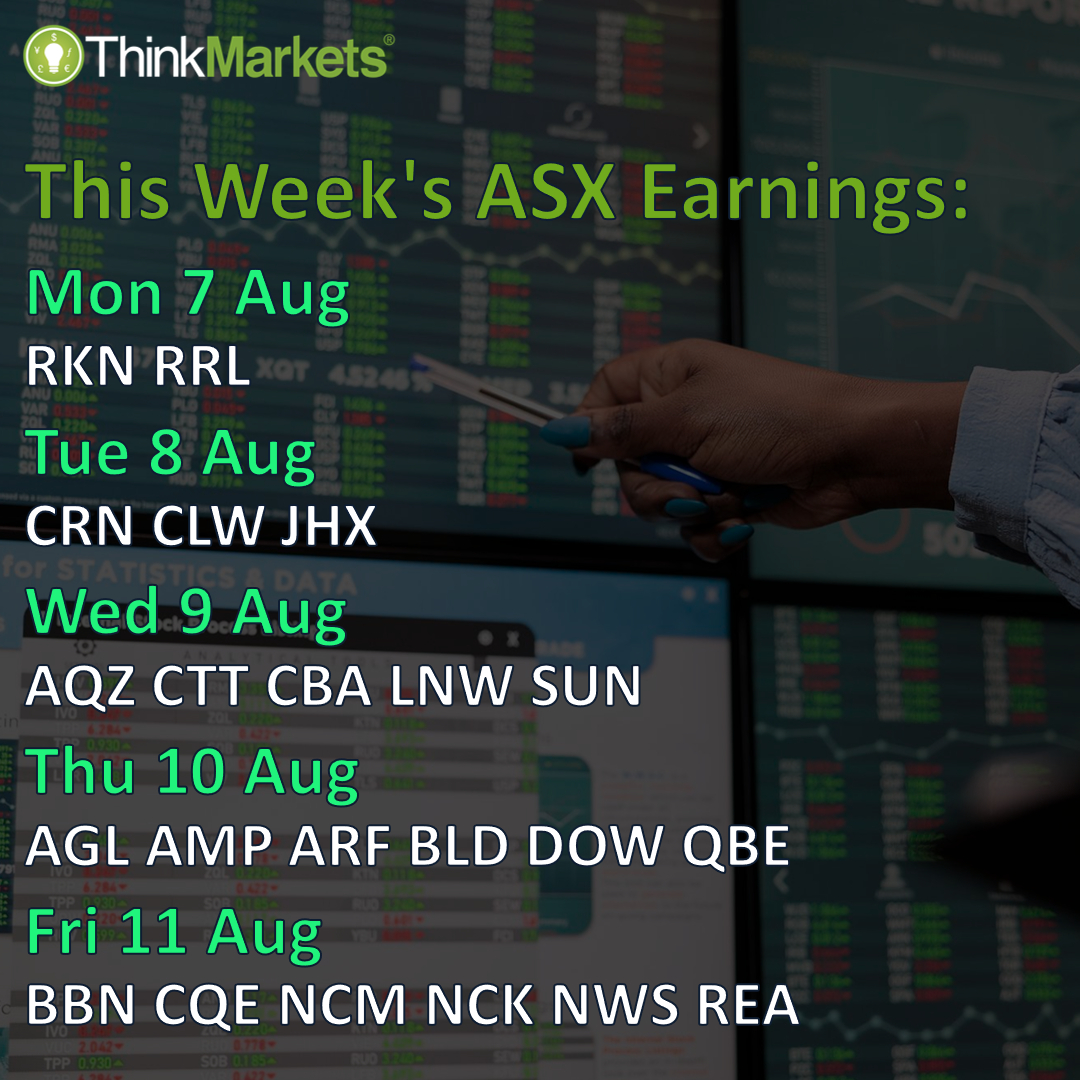
ASX200 technicals remain rangebound
The benchmark S&P ASX200 (XJO) remains stuck in a well-defined trading range between 6895 and 7633. Last week we saw a substantial black candle on 2 August which effectively nullified the promising short-term uptrend from the week before. The short-term trend ribbon (light green zone) should offer some modest interim demand support, but failing this, the long-term trend ribbon (dark green zone) beckons.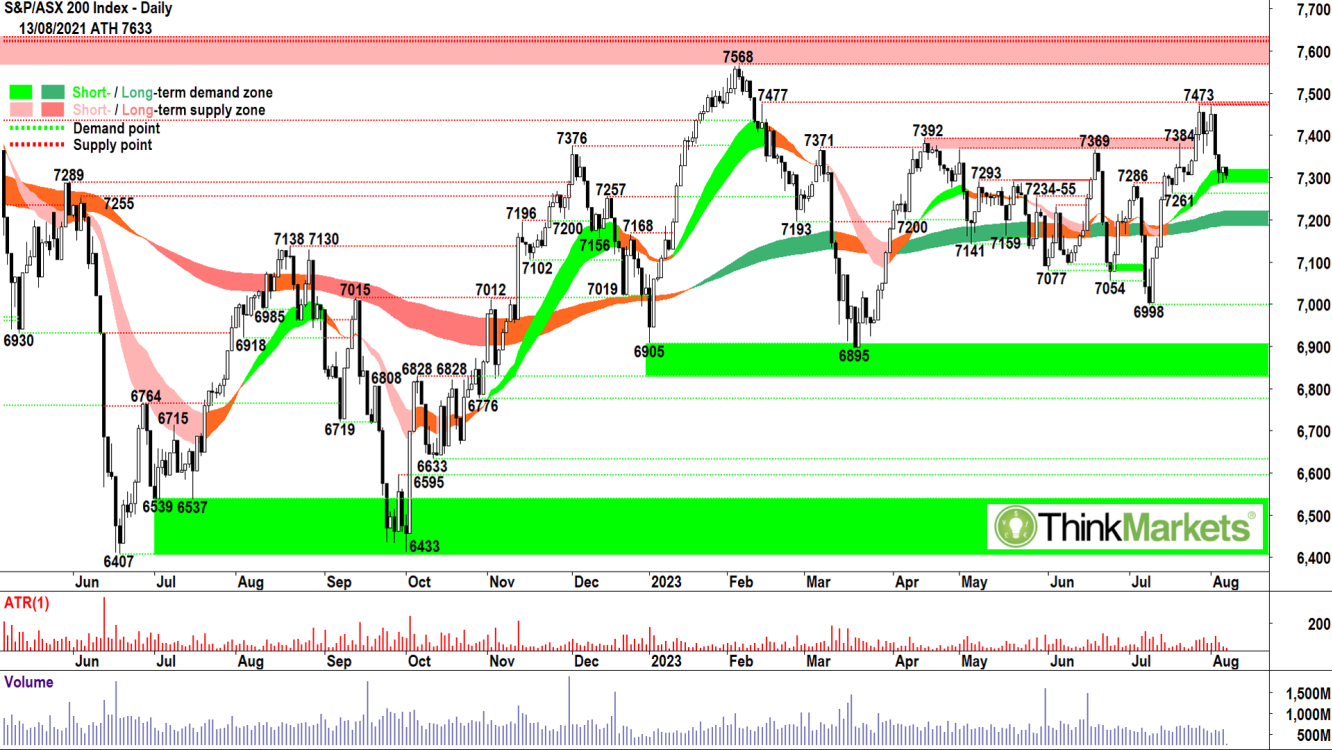
3, 4, and today's 7 August candles are disappointing, showing only a meek demand-side response to the renewed excess supply. I suggest moving to a more neutral stance on ASX shares more generally, where new capital is probably best left on the sidelines until at least a new short-term trend appears. Ideally, we find some demand/white bodied candles in the short-term trend ribbon and push back towards 7473. Otherwise, the downside is probably limited to 7200-ish.
3 ASX Stock Charts to Watch this Week:
Pro Medicus (ASX: PME)
Pro Medicus Limited provides healthcare imaging software and services to hospitals and diagnostic imaging groups in Australia, North America, and Europe. The Company's products include Visage RIS, Visage RIS/PACS, Visage 7, Visage Ease Pro and Visage Ease. Functions include radiology information systems, practice management, patient registration, billing and scheduling, and visualization capability.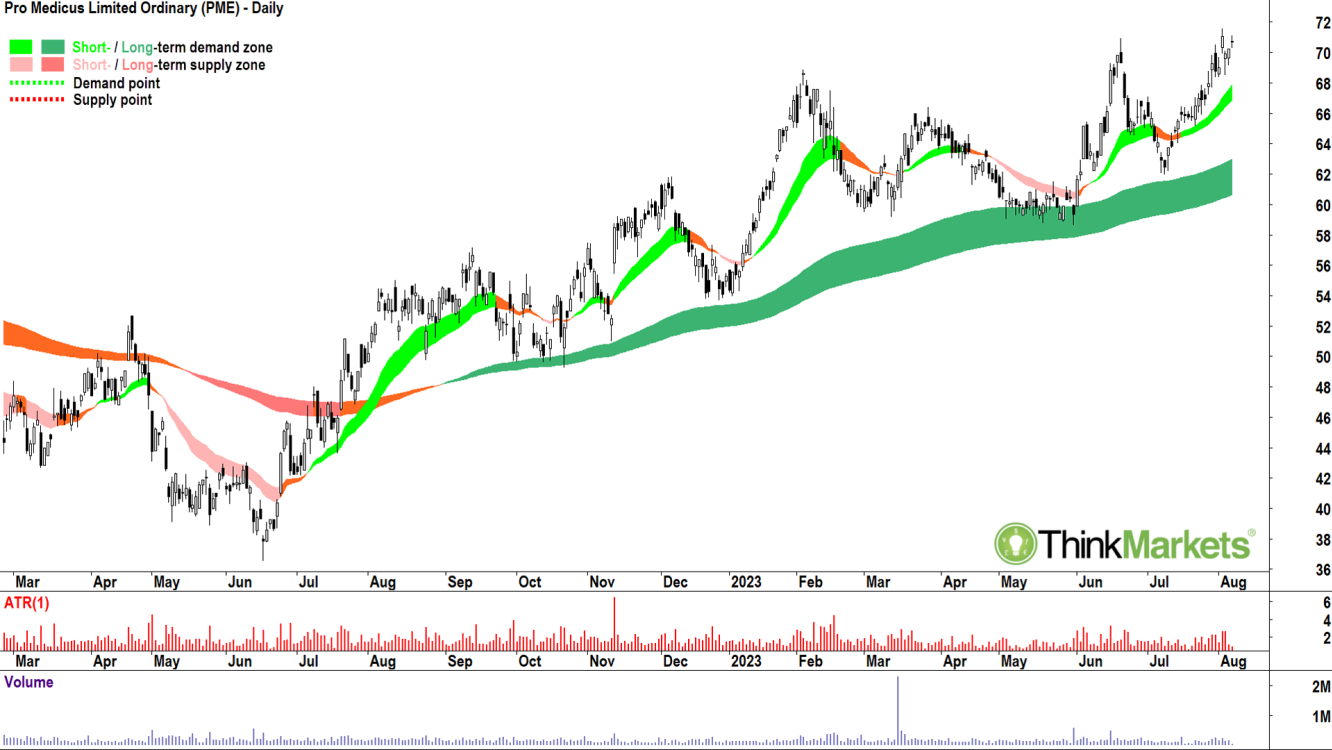
The Pro Medicus chart shows the price is in a well-established short-term uptrend (light green ribbon) and well-established long-term uptrend (dark green ribbon). The price action shows higher peaks and higher troughs. The candles are predominantly demand-side in nature (i.e., white bodies and/or upward pointing shadows). In combination, these technical factors demonstrate substantial excess demand for Pro Medicus shares.
The most recent peak on 2 August breached the major point of supply set at 70.99 on 21 June, and along with the fact the price is trading near all-time highs, there appears to be little excess supply in the system. This allows for an attractive upside potential.
Analysts view: I am comfortable adding risk to Pro Medicus around the current price and remaining in a long position while the price continues to trade above the short-term trend ribbon.
ALS (ASX: ALQ)
ALS provides professional technical services to the healthcare and mining industries. The Commodities segment provides assaying and analytical testing services and metallurgical services for mining and mineral exploration companies. The Life Sciences segment provides analytical testing data to assist consulting and engineering firms, industry, and governments around the world in making informed decisions about environmental, food and pharmaceutical, electronics, consumer products, and animal health.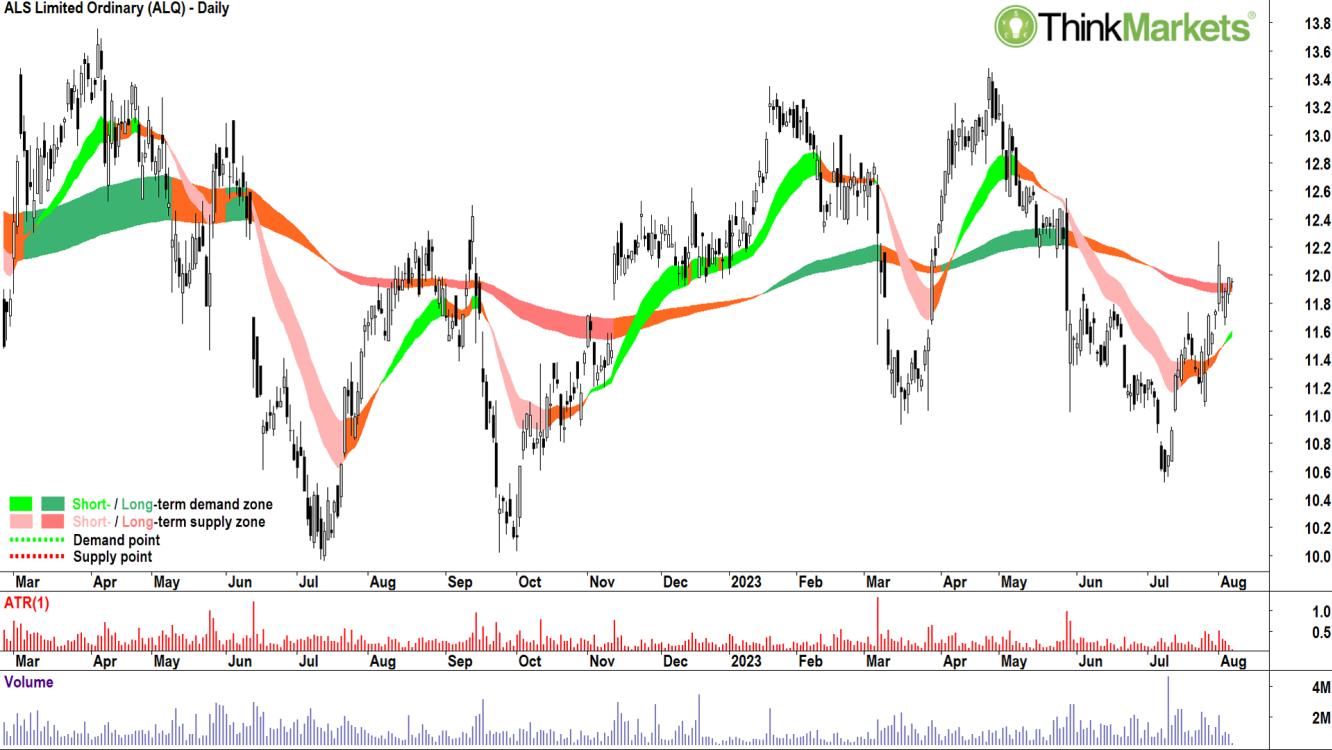
Where the PME chart is a continuation setup, the ALS chart is a turnaround setup. Turnaround setups are those where the long-term trend is not yet explicitly up, but it is demonstrating signs of transitioning to a long-term uptrend. The short-term trend, however, is clearly up, and the price action and candles suggest excess demand has returned to the system.
The ALS chart shows the price is in a new short-term uptrend, and the price action has returned to higher peaks and higher troughs. The candles are predominantly demand-side in nature. The long-term trend is down (amber ribbon) but has flattened and compressed, demonstrating downside momentum has abated.
The long-term trend ribbon is impeding short-term price action, however, if this level can be decisively breached, upside targets are to the major point of supply at 13.48 set on 26 April.
Analysts view: This is a more speculative trade setup than Pro Medicus, but I particularly like the overwhelming prevalence of white candles since the major swing low on 10 July. I am comfortable adding risk to ALS around the current price and remaining in a long position while the price continues to trade above the short-term trend ribbon.
GUD Holdings (ASX: GUD)
GUD Holdings operates in the automotive aftermarket and water products sectors in Australia and New Zealand. The Automotive segment provides automotive and heavy-duty filters for cars, trucks, agricultural and mining equipment, and fuel pumps. Brands include Ryco, Wesfil, Narva, Projecta, Injectronics, Goss and Permaseal. The APG segment manufactures and sells towing, trailering, accessories, and associated products for the automotive market. The Davey segment distributes pumps, pressure systems and purification equipment for household and agricultural use.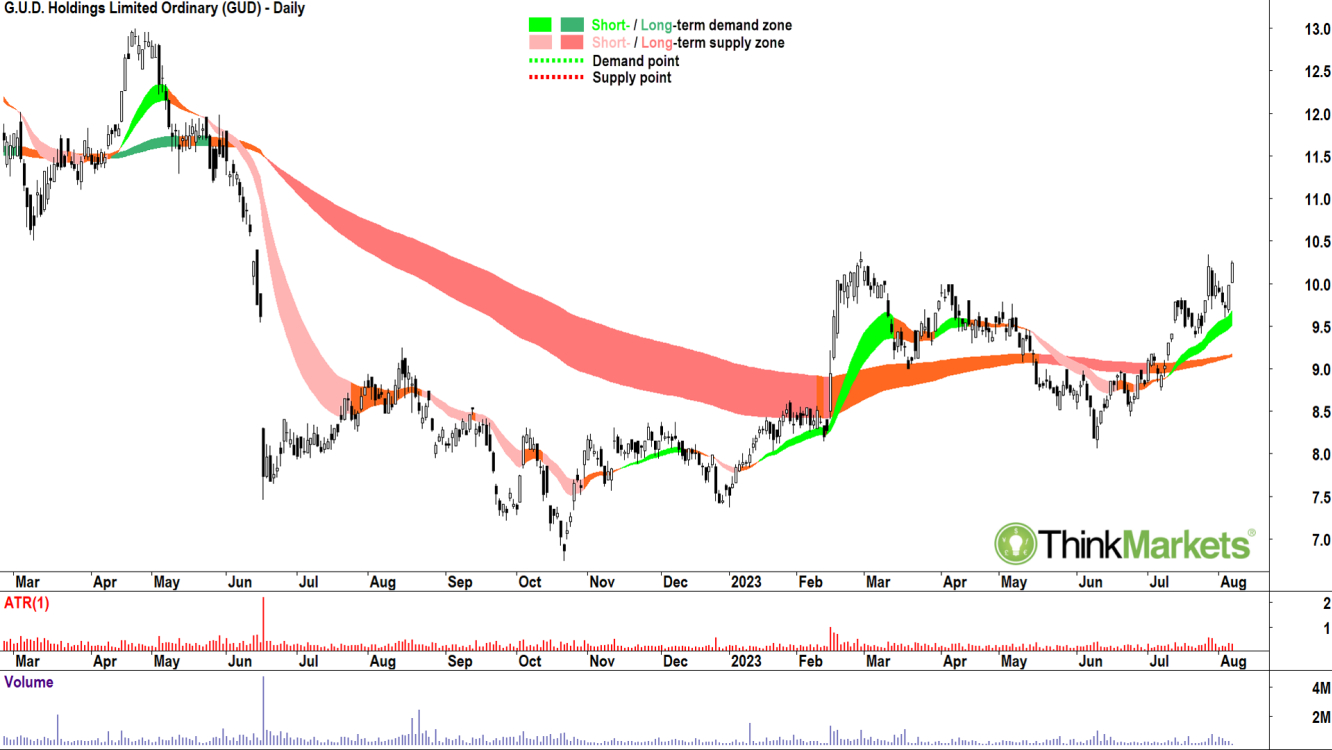
The GUD chart is another turnaround setup, but it is far more advanced in transitioning to a long-term uptrend than ALQ. The price is in a well-established short-term uptrend with price action demonstrating higher peaks and higher troughs. The candles are predominantly demand-side in nature. The long-term trend is down (amber ribbon) but is on the verge of officially transitioning to up. In combination, these technical factors demonstrate substantial excess demand for GUD shares.
The price action appears to be in the process of dealing with the major point of supply at 10.38 set on 28 February. Once this area is successfully breached, upside targets are to the major point of supply at 13.00 set on 22 April 2022.
Analysts view: A more speculative trade setup than Pro Medicus, but likely less so than ALQ. I particularly like the strong demand-side candles rebounding off the short-term trend ribbon. I am comfortable adding risk to GUD around the current price and remaining in a long position while the price continues to trade above the short-term trend ribbon.
Want More!?
For more stock picks and analysis, follow me on Twitter: @CarlCapolingua or read my regular articles at: ThinkMarkets Market News
About ThinkMarkets
Established in 2010, ThinkMarkets is a multi-awarded provider of online trading services. We are fully committed to making trading accessible to everyone, highlighting great importance on trading education and financial literacy. Go to: https://www.thinkmarkets.com for more information.
