US housing data released last week encouraged investors, as Housing Starts, Building Permits and Existing Home Sales all beat expectations.
Despite the economic uncertainties amid the novel coronavirus pandemic, the residential construction statistics released jointly by the US Census Bureau and the US Department of Housing and Urban Development on Aug. 18 demonstrated the health and resiliency of the housing sector. These figures bolstered optimism for recovery and by Friday, not only did housing sector stocks make fresh highs but the S&P 500 and NASDAQ also ended the week at new record closing levels.
Below we’ll address catalysts for the positive momentum, potential headwinds and two exchange-traded funds (ETFs) that should be on your radar.
Housing Stocks Power Higher
2019 was a strong year for the US housing market as the Fed reversed course from 2018 and cut interest rates. The result: low mortgage rates made buying homes more affordable for millions. Analysts expect the housing market to echo the annual growth in the economy and by all accounts, 2020 also started the year on a strong foot.
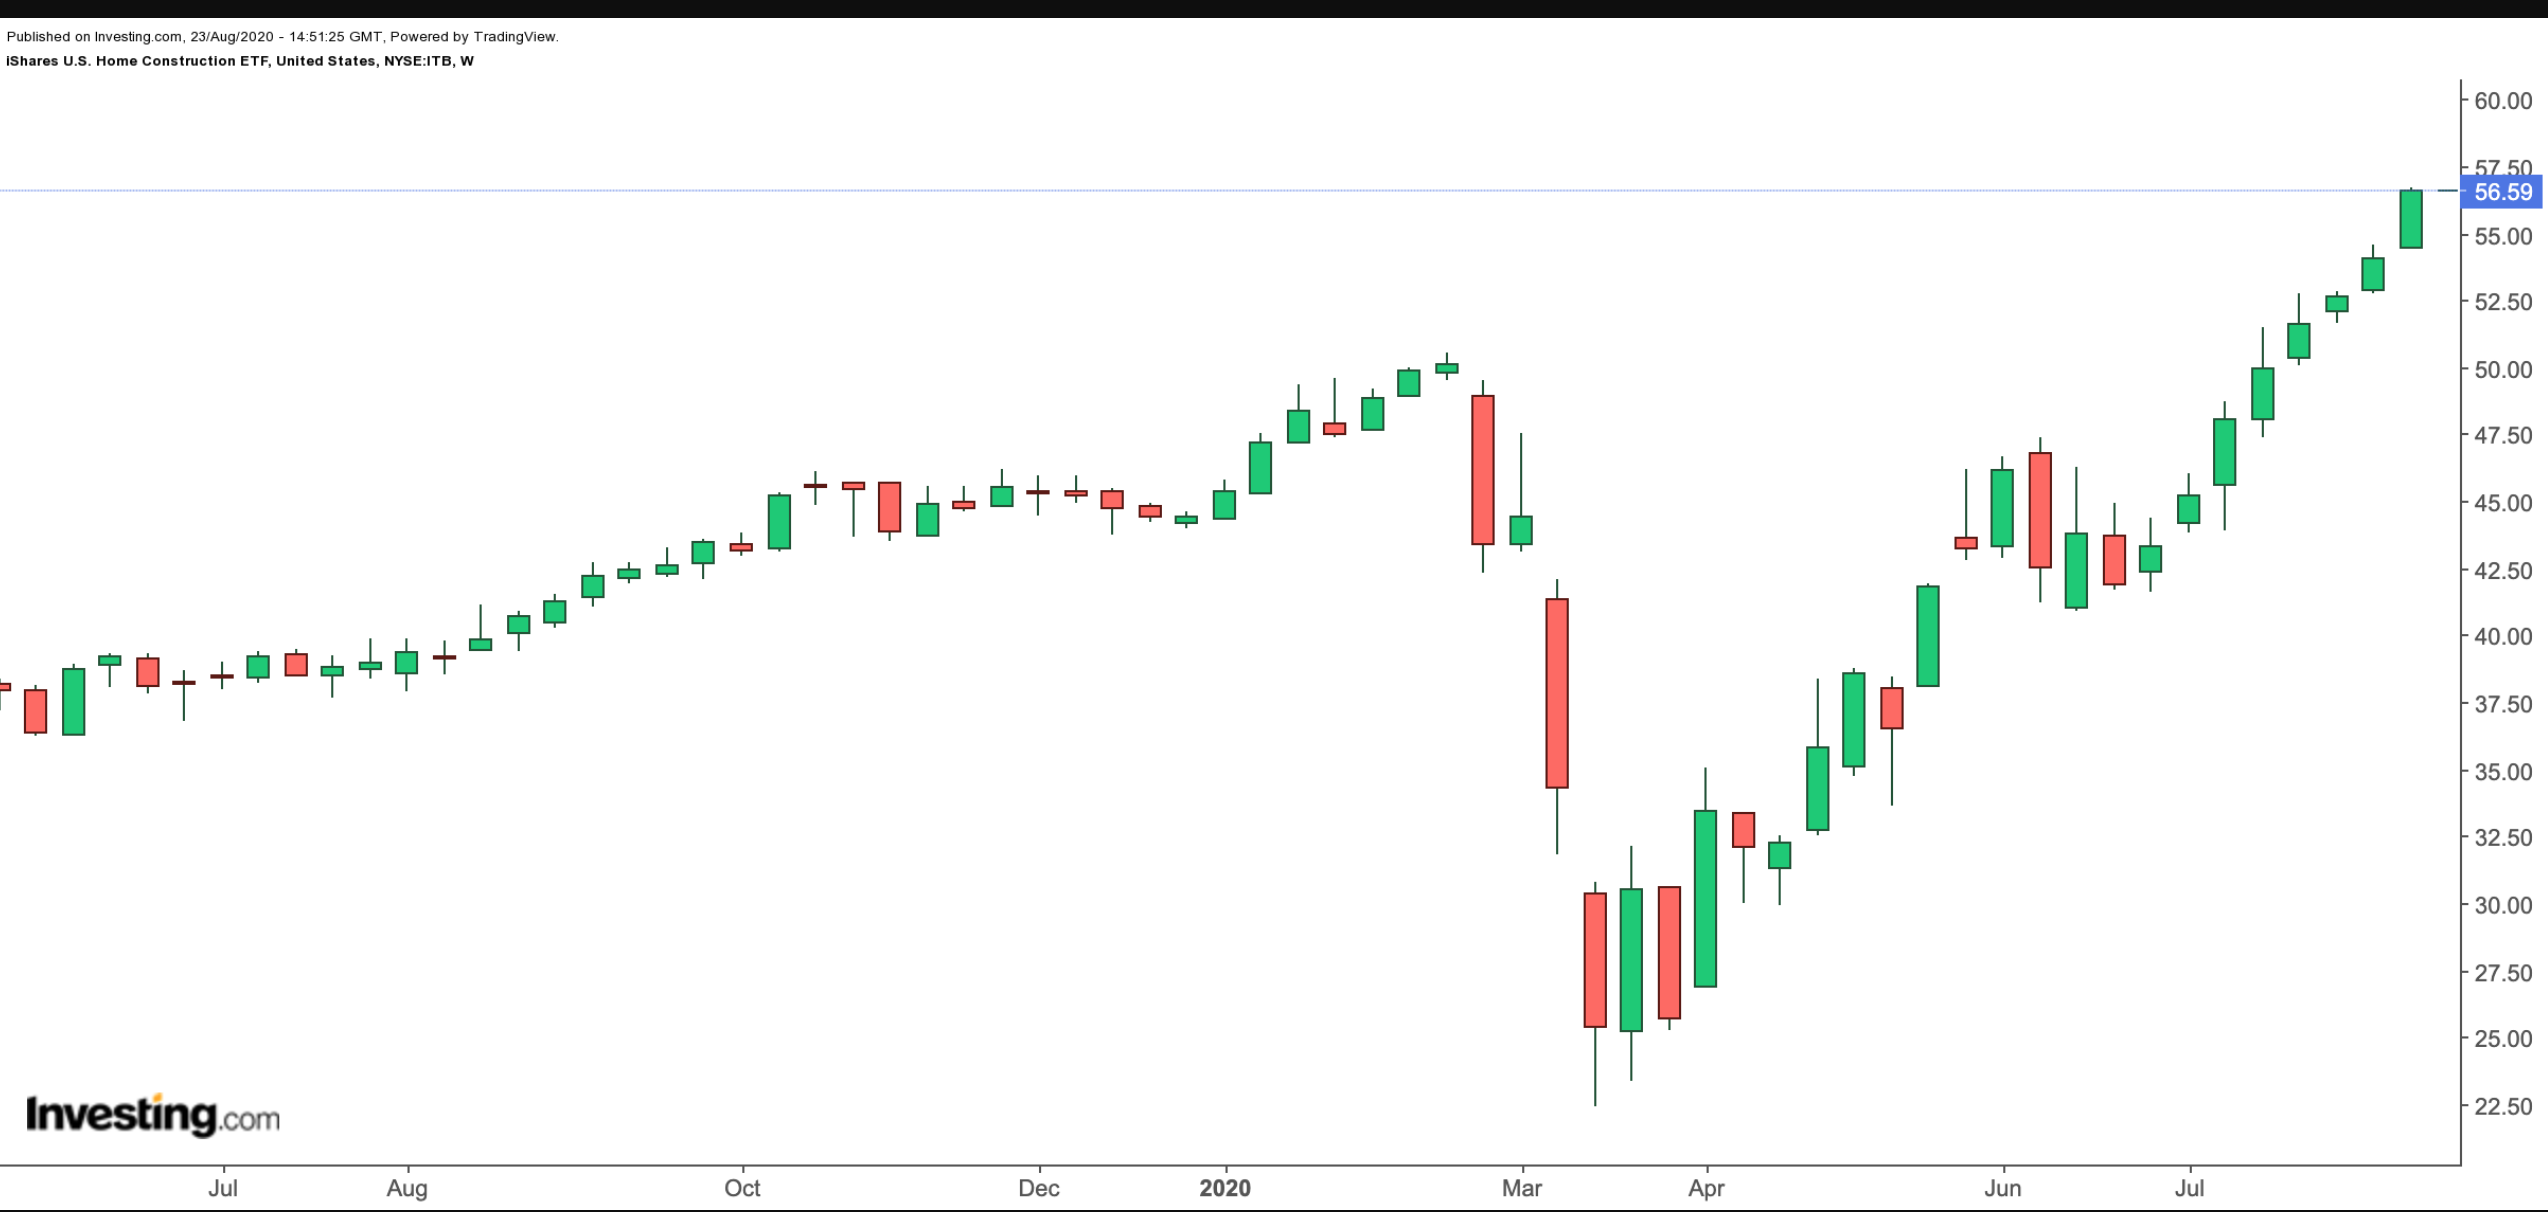
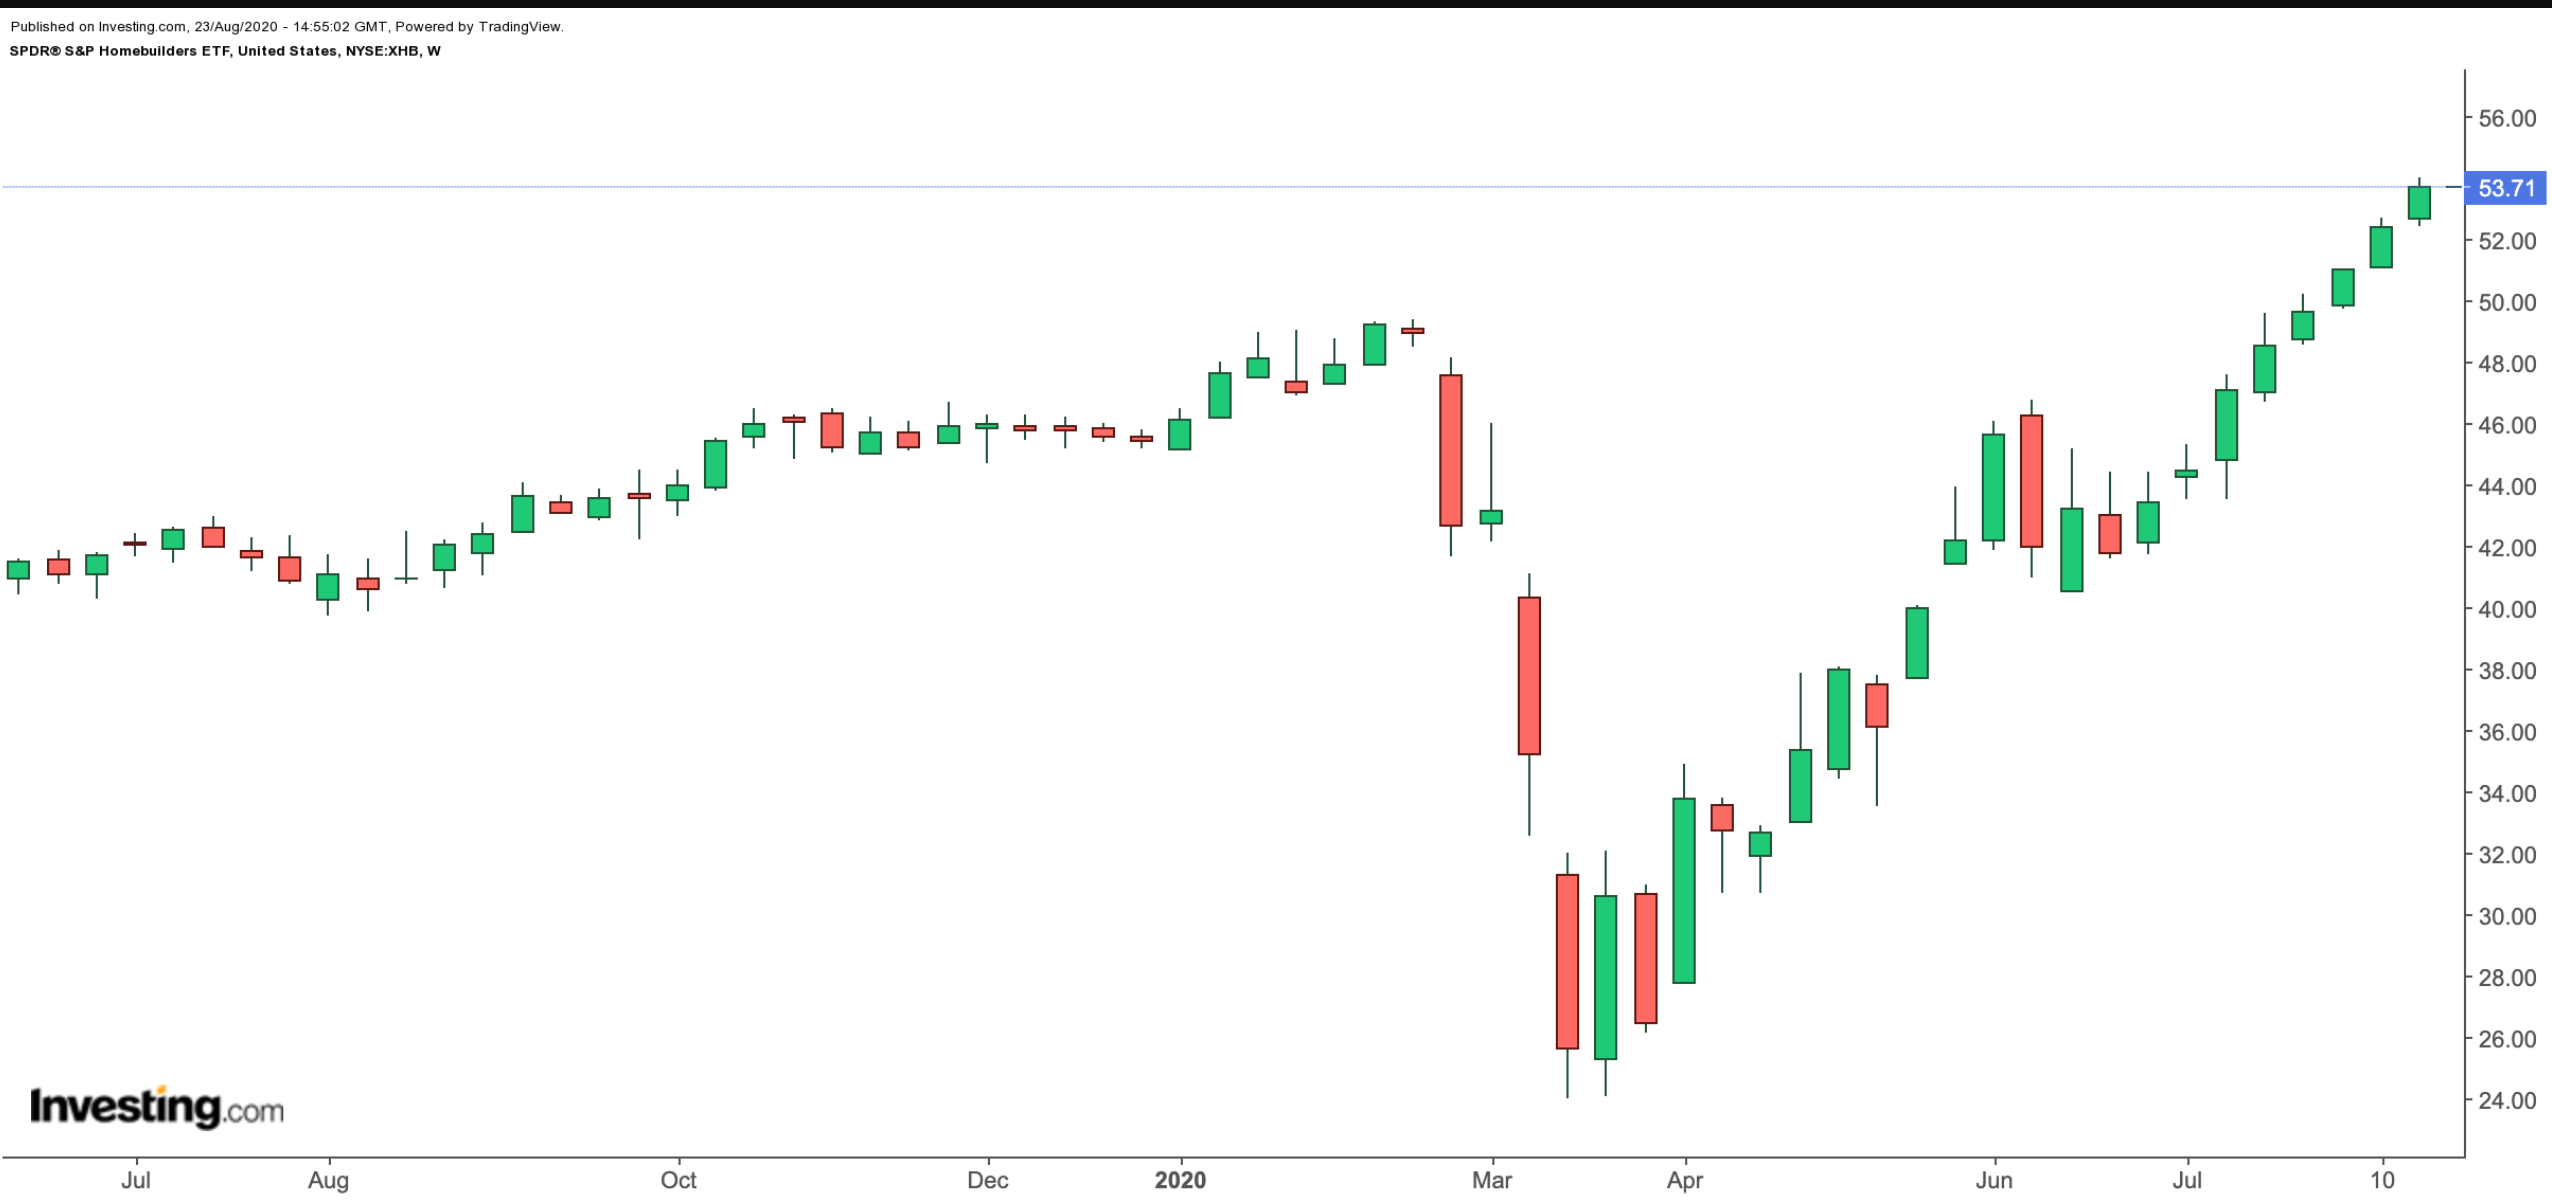
However, when COVID-19's impact was initially felt in the US, shares of housing companies—like most other sectors—crashed in March. Since the initial shock of the pandemic passed and measures have been implemented to manage the risks to some degree, the housing sector has made an incredible turn-around with companies powering to 52-week or even all-time highs.
What's behind this surge in home sector stock prices? Recent data reveals Americans are re-entering the housing market in droves likely due to a combination of factors.
The public has been spending more time at home in response to coronavirus and many businesses have shifted to remote working practices. At the same time, the Fed slashed interest rates further to record lows, incentivizing more people to buy homes. All this has served to spur households interest in larger properties in the suburbs, away from cities where housing costs are typically high. Newly-built homes, in particular, are seeing a spike in demand.
Still, COVID-19 continues to pose significant risks to the economy. Thus, it is not possible to know how long the uptrend in the housing market will last. However, we may well be in a multi-year boom cycle in the industry.
Those investors who believe the long-term strength in housing is likely to continue may do further due diligence on the following two ETFs.
1. iShares U.S. Home Construction ETF
- Current Price: $56.59
- 52-week range: $22.39-$56.69
- Current Dividend Yield (TTM-Trailing Twelve Month): 0.46%
- Expense ratio: 0.42% per year, or $42 on a $10,000 investment
The iShares US Home Construction ETF (NYSE:ITB) offers exposure to US companies that manufacture residential homes as well as to domestic homebuilding stocks.

ITB, which tracks the Dow Jones US Select Home Construction index, currently has 44 holdings. The top three are DR Horton (NYSE:DHI), Lennar (NYSE:LEN) and NVR (NYSE:NVR). The shares of these three firms comprise around 37% of net assets, which stand at around $2.2 billion.
The most significant sectors by weighting include Homebuilding (66.12%), Building Products (14.17%) and Home Improvement Retail (9.77%).
Year-to-date, ITB is up over 27%. In fact, on Aug. 21, it hit an all-time high at $56.69. Its trailing P/E and P/B stand at 17.51 and 2.45 respectively.
A prolonged second-wave of the pandemic in the coming months may take some of the buzz away from the home-building activity that has recently staged a significant turnaround. There could possibly also be short-term profit-taking in ITB, which would offer better value if the price declined toward the $52.5-level.
2. The SPDR S&P Homebuilders ETF
- Current Price: $53.71
- 52-week range: $23.95-$53.95
- Current Dividend Yield (TTM-Trailing Twelve Month): 0.81%
- Expense ratio: 0.35% per year, or $35 on a $10,000 investment
The SPDR S&P Homebuilders ETF (NYSE:XHB), which has 35 holdings, tracks the S&P Homebuilders Select IndustryTM index. Assets under management stand at $1.2 billion.

The fund’s sub-industry allocation centers around Building Products (38.78%), Homebuilding (31.75%) and Home Improvement Retail (11.40%).
XHB provides exposure across large-, mid-, and small-cap stocks, each with a weighting between 4%-5%. The top three companies in the fund are Whirlpool (NYSE:WHR), DR Horton and PulteGroup (NYSE:PHM).
So far in the year, XHB is up over 18%. Like ITB, XHB also saw its all-time high on Aug. 21, reaching the $53.71 level. Its trailing P/E and P/B stand at 18.40 and 2.81 respectively. Long-term investors may consider buying the fund, especially if XHB comes under short-term pressure and slides below $50, and especially toward $47.5.
