Breaking News
Investing Pro 0
Final hours: unlock premium data with Claim 60% OFF

Stocks rally, dollar falls after U.S. data, ECB hike, hawkish Fed pause

Published Jun 15, 2023 12:13 Updated Jun 16, 2023 06:44
Saved. See Saved Items.
This article has already been saved in your Saved Items
 
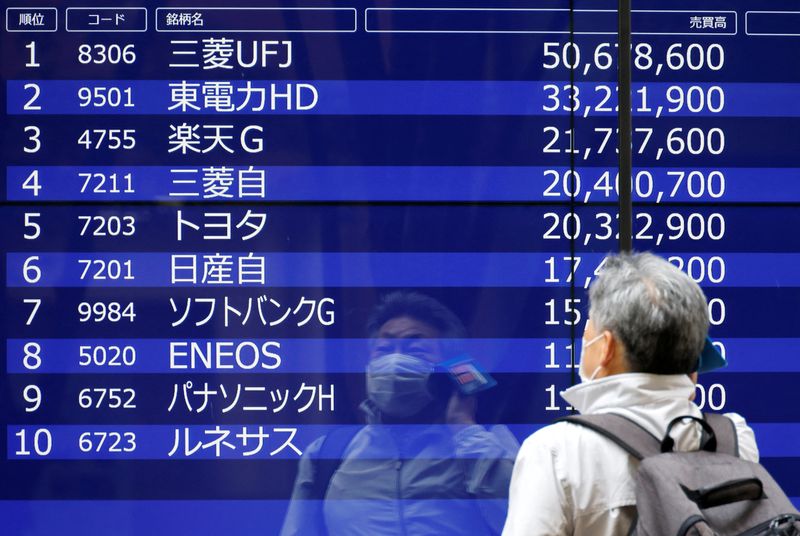
© Reuters. FILE PHOTO: A man is reflected on an electric monitor displaying a stock quotation board outside a bank in Tokyo, Japan, June 5, 2023. REUTERS/Issei Kato/ FILE PHOTO
 
XAU/USD
-1.19%
Add to/Remove from a Portfolio
Add to Watchlist
Add Position

Position added successfully to:

Please name your holdings portfolio
 
US500
+0.41%
Add to/Remove from a Portfolio
Add to Watchlist
Add Position

Position added successfully to:

Please name your holdings portfolio
 
DJI
+0.36%
Add to/Remove from a Portfolio
Add to Watchlist
Add Position

Position added successfully to:

Please name your holdings portfolio
 
DX
+0.45%
Add to/Remove from a Portfolio
Add to Watchlist
Add Position

Position added successfully to:

Please name your holdings portfolio
 
Gold
-1.25%
Add to/Remove from a Portfolio
Add to Watchlist
Add Position

Position added successfully to:

Please name your holdings portfolio
 
LCO
+2.16%
Add to/Remove from a Portfolio
Add to Watchlist
Add Position

Position added successfully to:

Please name your holdings portfolio
 

By Sinéad Carew and Marc Jones

NEW YORK, LONDON (Reuters) - MSCI's global index of stocks rose on Thursday to its highest level since April 2022 after strong U.S. economic data, but the dollar slid following the European Central Bank's interest rate increase a day after the Federal Reserve paused its hikes.

While U.S. jobless claims were higher than expected, retail sales unexpectedly rose in May as consumers stepped up purchases of motor vehicles and building materials, which could help to stave off a recession in the near term.

The euro hit a 15-year peak against the Japanese yen and a five-week high against the dollar after the ECB lifted interest rates to a two-decade high of 3.5% and eyed more hikes ahead.

Equities trading had been choppy on Wednesday after the Fed signaled it could follow its June pause with two more rate increases this year. But on Thursday afternoon the S&P 500 and the Nasdaq were rallying sharply and registered their highest closing levels in roughly 14 months.

Higher jobless claims helped fuel bets that the Fed would not follow through with more rate hikes. This, combined with higher-than-expected retail sales, looked like "the ingredients for a soft landing" for the U.S economy, said Irene Tunkel, chief US equity strategist at BCA Research.

"It's almost like a sweet spot," Tunkel said, also pointing to Chinese data boosting energy stocks and oil prices. "So, sentiment-wise the mood is positive."

The Dow Jones Industrial Average rose 428.73 points, or 1.26%, to 34,408.06, the S&P 500 gained 53.25 points, or 1.22%, to 4,425.84 and the Nasdaq Composite added 156.34 points, or 1.15%, to 13,782.82.

MSCI's gauge of stocks across the globe gained 1.01%.

But the dollar index, measuring the greenback against major currencies, fell 0.787%, with the euro up 1.06% to $1.0946 after earlier hitting a high of $1.09520.

The Japanese yen weakened 0.11% versus the greenback at 140.24 per dollar, while Sterling was last trading at $1.2782, up 0.96% on the day.

"Beyond the near-term outlook for rates, the U.S. dollar may be looking at a somewhat more challenging environment. The global monetary policy cycle is approaching its end game," said Shaun Osborne, chief FX strategist, said at Scotiabank in Toronto adding that the rate-cycle peak would be negative for the dollar as it would boost appetites for riskier bets.

U.S. Treasury yields were lower as investors digested the economic data and the Fed's update.

Benchmark 10-year notes were down 8 basis points to 3.718%, from 3.798% late on Wednesday. The 30-year bond was last down 3.9 basis points to yield 3.8421% while the 2-year note was last was down 6.5 basis points to yield 4.6418%.

In commodities, oil prices rose more than 3% as the dollar weakened and data showed a jump in refinery runs in top crude importer China, though a weak economic backdrop capped gains.

U.S. crude settled up 3.44% at $70.62 per barrel and Brent was at $75.67, up 3.37% on the day.

Gold prices rose from a three-month low as the dollar and bond yields fell after U.S. economic data.

Spot gold added 0.8% to $1,958.04 an ounce. U.S. gold futures gained 0.15% to $1,958.30 an ounce.
Stocks rally, dollar falls after U.S. data, ECB hike, hawkish Fed pause
 

Related Articles

Add a Comment

Comment Guidelines

We encourage you to use comments to engage with users, share your perspective and ask questions of authors and each other. However, in order to maintain the high level of discourse we’ve all come to value and expect, please keep the following criteria in mind: 

  • Enrich the conversation
  • Stay focused and on track. Only post material that’s relevant to the topic being discussed.
  • Be respectful. Even negative opinions can be framed positively and diplomatically.
  •  Use standard writing style. Include punctuation and upper and lower cases.
  • NOTE: Spam and/or promotional messages and links within a comment will be removed
  • Avoid profanity, slander or personal attacks directed at an author or another user.
  • Don’t Monopolize the Conversation. We appreciate passion and conviction, but we also believe strongly in giving everyone a chance to air their thoughts. Therefore, in addition to civil interaction, we expect commenters to offer their opinions succinctly and thoughtfully, but not so repeatedly that others are annoyed or offended. If we receive complaints about individuals who take over a thread or forum, we reserve the right to ban them from the site, without recourse.
  • Only English comments will be allowed.

Perpetrators of spam or abuse will be deleted from the site and prohibited from future registration at Investing.com’s discretion.

Write your thoughts here
 
Are you sure you want to delete this chart?
 
Post
Post also to:
 
Replace the attached chart with a new chart ?
1000
Your ability to comment is currently suspended due to negative user reports. Your status will be reviewed by our moderators.
Please wait a minute before you try to comment again.
Thanks for your comment. Please note that all comments are pending until approved by our moderators. It may therefore take some time before it appears on our website.
 
Are you sure you want to delete this chart?
 
Post
 
Replace the attached chart with a new chart ?
1000
Your ability to comment is currently suspended due to negative user reports. Your status will be reviewed by our moderators.
Please wait a minute before you try to comment again.
Add Chart to Comment
Confirm Block

Are you sure you want to block %USER_NAME%?

By doing so, you and %USER_NAME% will not be able to see any of each other's Investing.com's posts.

%USER_NAME% was successfully added to your Block List

Since you’ve just unblocked this person, you must wait 48 hours before renewing the block.

Report this comment

I feel that this comment is:

Comment flagged

Thank You!

Your report has been sent to our moderators for review
Continue with Google
or
Sign up with Email