A look at the day ahead in U.S. and global markets by Amanda Cooper
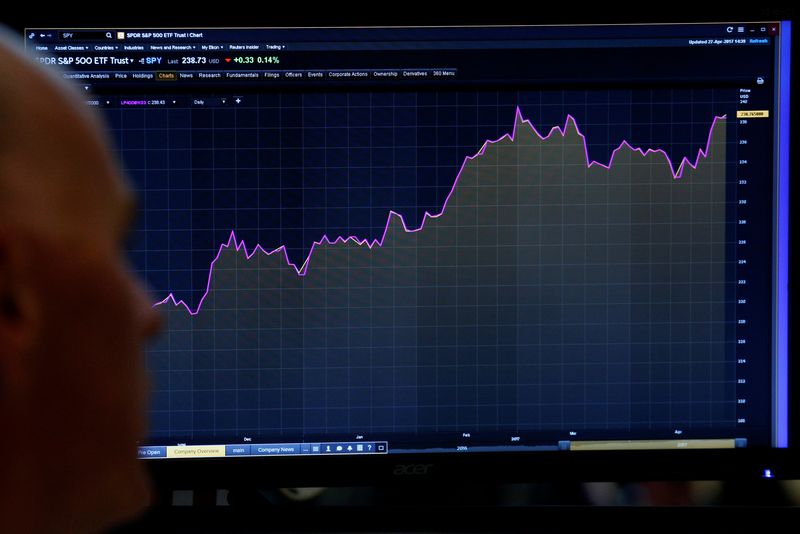
It's taken two years and a lot of hand-wringing in the meantime, but on Friday, the S&P 500 secured its first record-high close in two years - effectively marking the shift from a bear to a bull market.
The benchmark's close confirmed that the S&P 500 has been in a bull market since closing at its intraday low on Oct. 12, 2022, according to one measure.
The index gained 24% last year despite fairly meagre profit growth - earnings are expected to have risen by just 2.8% for the whole of 2023, according to LSEG data. So far in January, it's up 1.5%. One of the concerns around the robustness of the S&P's run higher last year was that of the breadth of the rally, which was concentrated among the so-called "Magnificent Seven" largest stocks, including Apple (NASDAQ:AAPL), Microsoft (NASDAQ:MSFT), Nvidia and Meta.
This latest record has been fuelled once again by the chipmakers and other big tech stocks. Bank of America (NYSE:BAC)'s January global fund manager survey showed participants believe the most crowded trade right now is still the Magnificent Seven. A S&P sector index for tech stocks, which includes Apple and Intel (NASDAQ:INTC) has risen by more than 70% since the lows of October 2022, while an index for the communications sector, which includes Meta and Netflix (NASDAQ:NFLX), is up 60% in that time.
Taking a look at the performance of the market since October 2023, when the S&P fell to five-month lows, the picture isn't quite as one-sided. The S&P is up 18% since then, while the equal-weight index has almost kept pace and small caps have nudged slightly ahead, up 19%.
With stocks beyond the clutch of Wall Street's most valuable, these metrics would suggest the rally is broadening out. The BofA monthly fund manager survey also showed that nearly 80% expected a soft, or "no landing" scenario for the economy in 2024, while a record 91% expect bond yields - proxy for central bank interest rates - to be lower in 12 months.
That said, when the S&P entered a bear market in October 2022, both the macro and the geopolitical backdrop looked rather different.
Interest rates were at 3.25% and heading higher, compared with 5.50% now, while inflation was at 7.7%, more than double where it was at the last count at 3.4%.
Much of the S&P bull market has been fed by the tailwind from the prospect of the Federal Reserve cutting interest rates swiftly this year as inflation slows. But the timing and the depth of those cuts are up for debate, especially if a turn for the worse in the economy requires monetary policy to loosen that quickly.
Whether the S&P bull is real, or purely AI-generated, remains to be seen, particularly if the real economy starts to show definite signs of weakness. But for now, investors appear happy to run with it.
Key developments that should provide more direction to U.S. markets later on Monday:

* 3- and 6-month T-bill auctions
* December leading indicator index