Oil Seeps Lower:
Oil prices seeped to their lowest level in over 6 years, breaking swing lows as oversupply was confirmed as not being abated any time soon. OPEC meetings ended with no resolution on production cuts and lacked any reference to output ceilings which was the big kicker in sending Oil to new lows.
Other commodities were also prominent in the overnight news cycle, with major Australian export Iron Ore falling to lows, and now trading with a $30 handle next to its name. Those break-even prices continue to slip further and further away for many of the mid to smaller miners… well anyone not named BHP Billiton Ltd (N:BHP) or Rio Tinto (L:RIO) really. When the smaller end of town is forced out of the market, the supply side of the equation will come back into play and could send the Aussie higher.
Certainly a potential storyline to follow if you’re trading the Aussie.
AUD/USD 4 Hourly:
Click on chart to see a larger view.
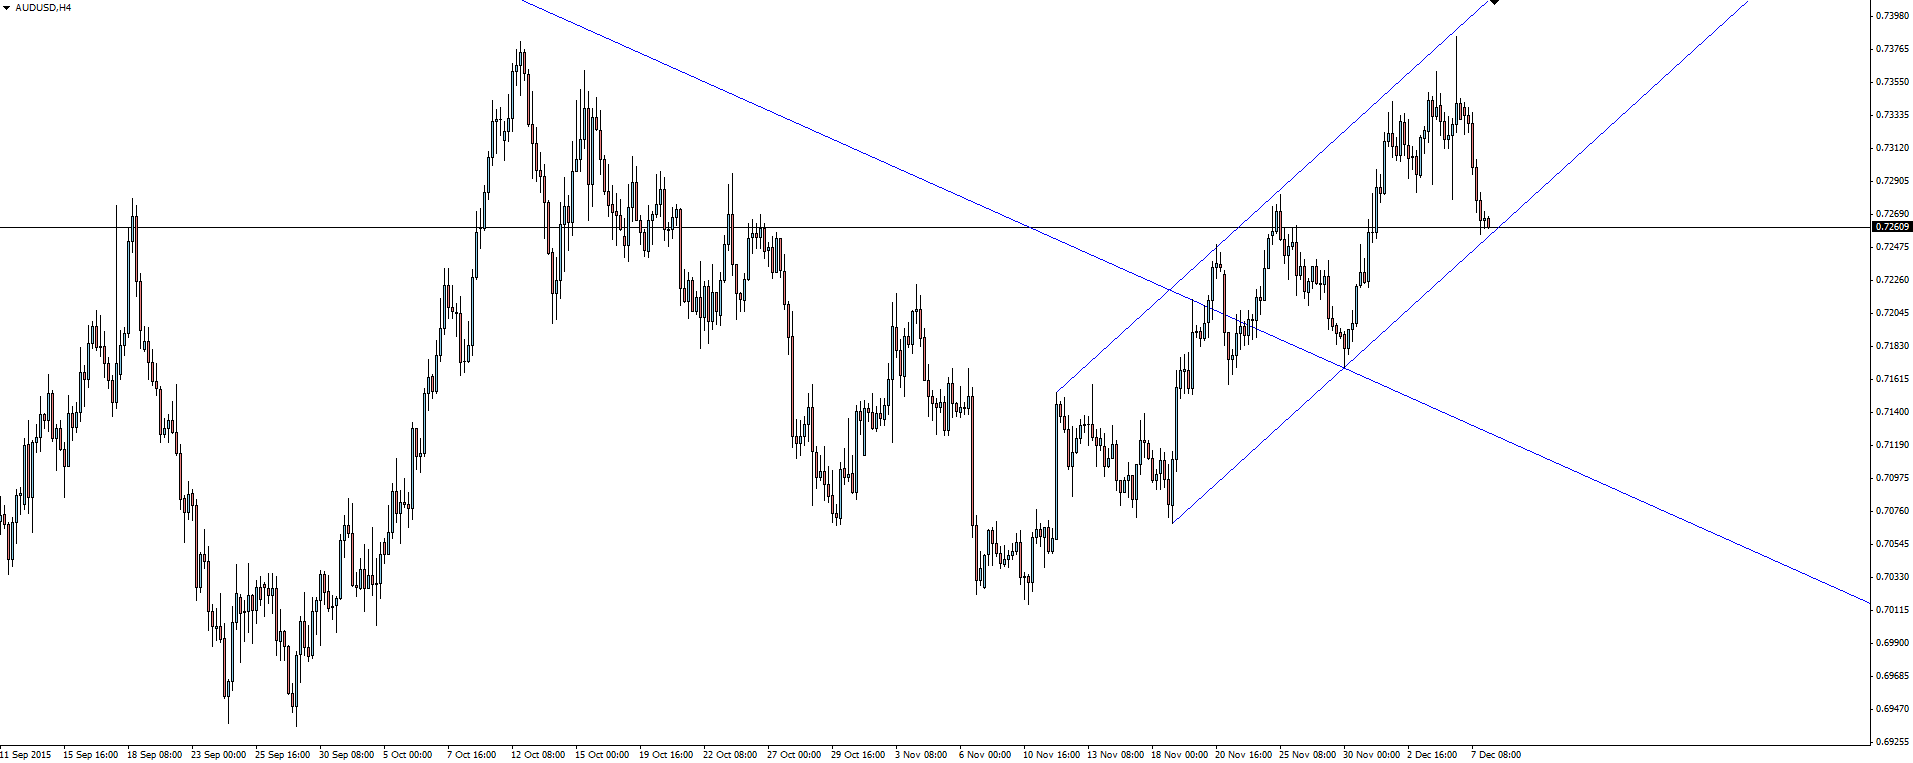
Of course the Aussie dollar took a hit on the back of these price headlines and after breaking out of its bearish channel, it is now crunch time for the short term change of trend.
CAD Spurts Higher:
Moving back to the oil narrative, the commodity currency most affected is of course the Canadian dollar.
USD/CAD 4 Hourly:
Click on chart to see a larger view.
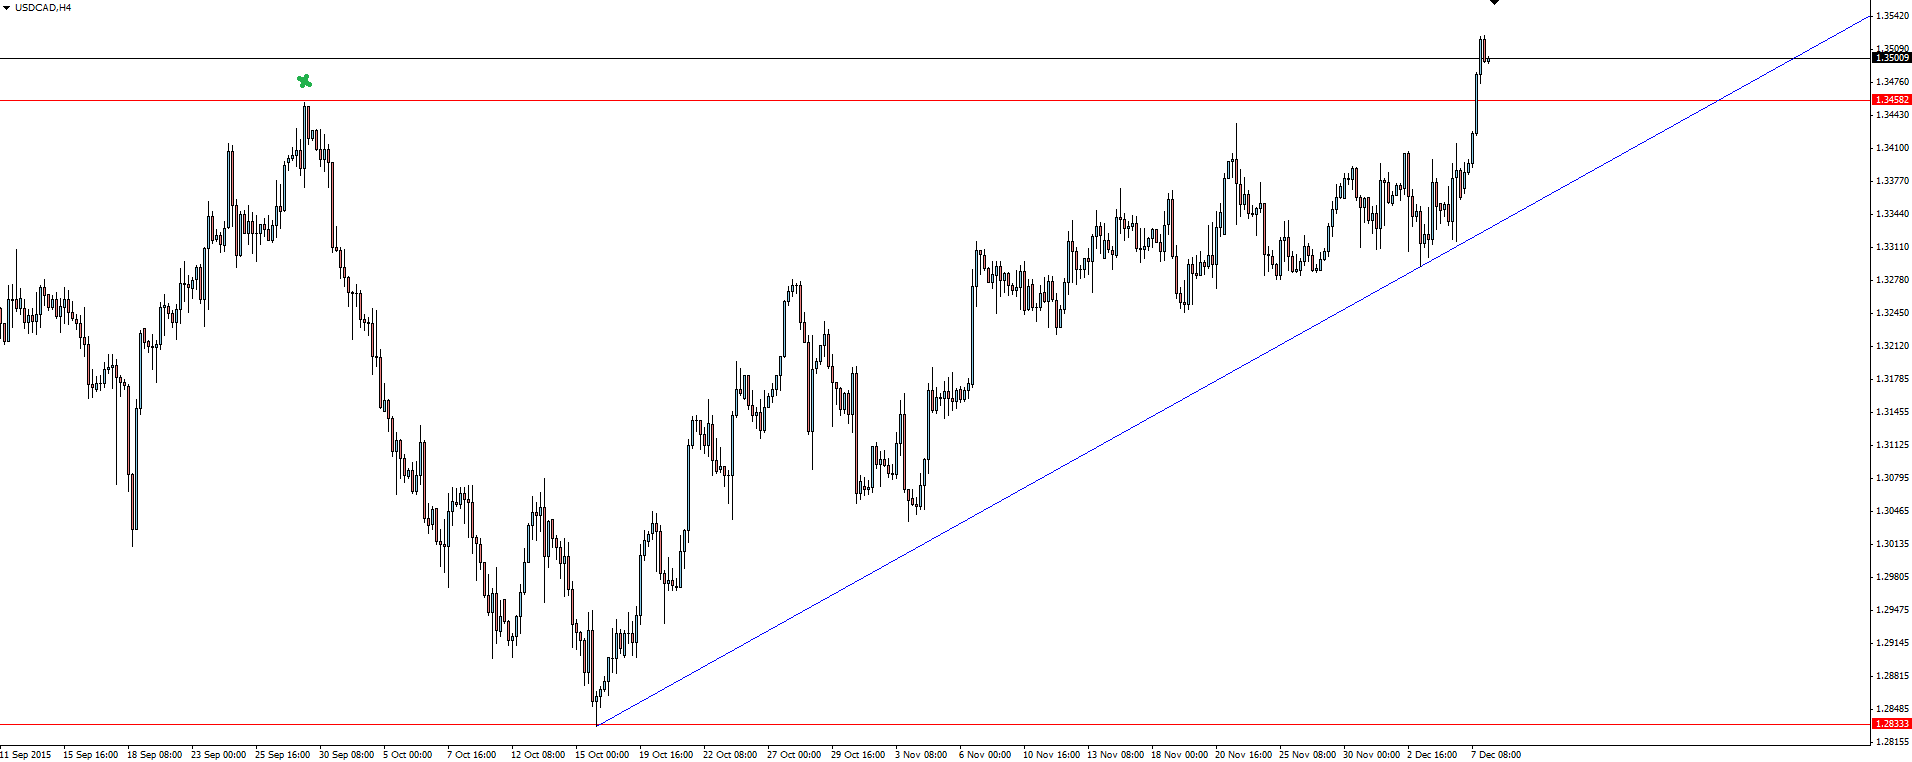
The CAD fell 1.2%, sending USD/CAD spurting higher to its highest level since 2004.
After coiling into a massive ascending triangle where each higher low soaked up the diminishing sellers, the only way for price to go was up.
Image: Phillips & Company
Featured on the Forex Calendar Tuesday:
AUD NAB Business Confidence
CNY Trade Balance
EUR Italian Bank Holiday
GBP Manufacturing Production m/m
CAD Building Permits m/m
CAD BOC Gov Poloz Speaks
Italian banks will be closed in observance of Immaculate Conception Day:
“The Feast of the Immaculate Conception celebrates the solemn belief in the Immaculate Conception of the Blessed Virgin Mary. It is universally celebrated on December 8, nine months before the feast of the Nativity of Mary.”
———-
Chart of the Day:
Lets take a closer look at the oil chart.
Oil Daily:
Click on chart to see a larger view.
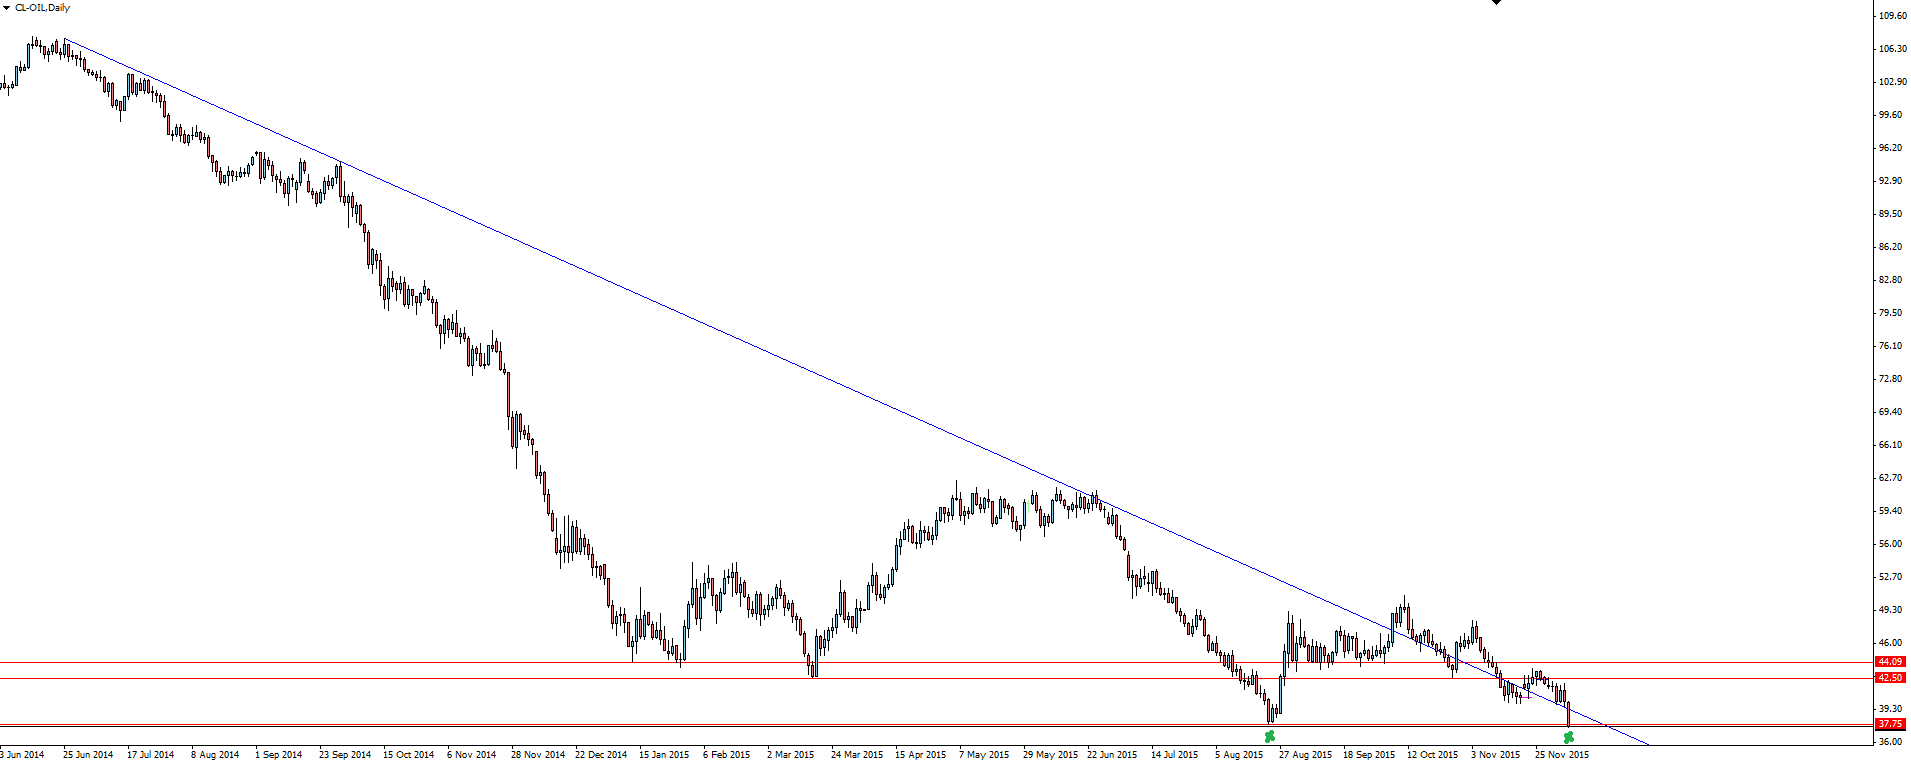
Taking a look at our first daily chart, we can see that oil, after failing to hold onto any sort of sustained break out, has been hugging its major bearish trend line. After last night’s price action, the bulls look to have finally given up on the level and we have now dropped back inside the trend line.
From here, we will be watching whether price re-tests the trend line as resistance again and look to short from there.
Oil Daily 2:
Click on chart to see a larger view.
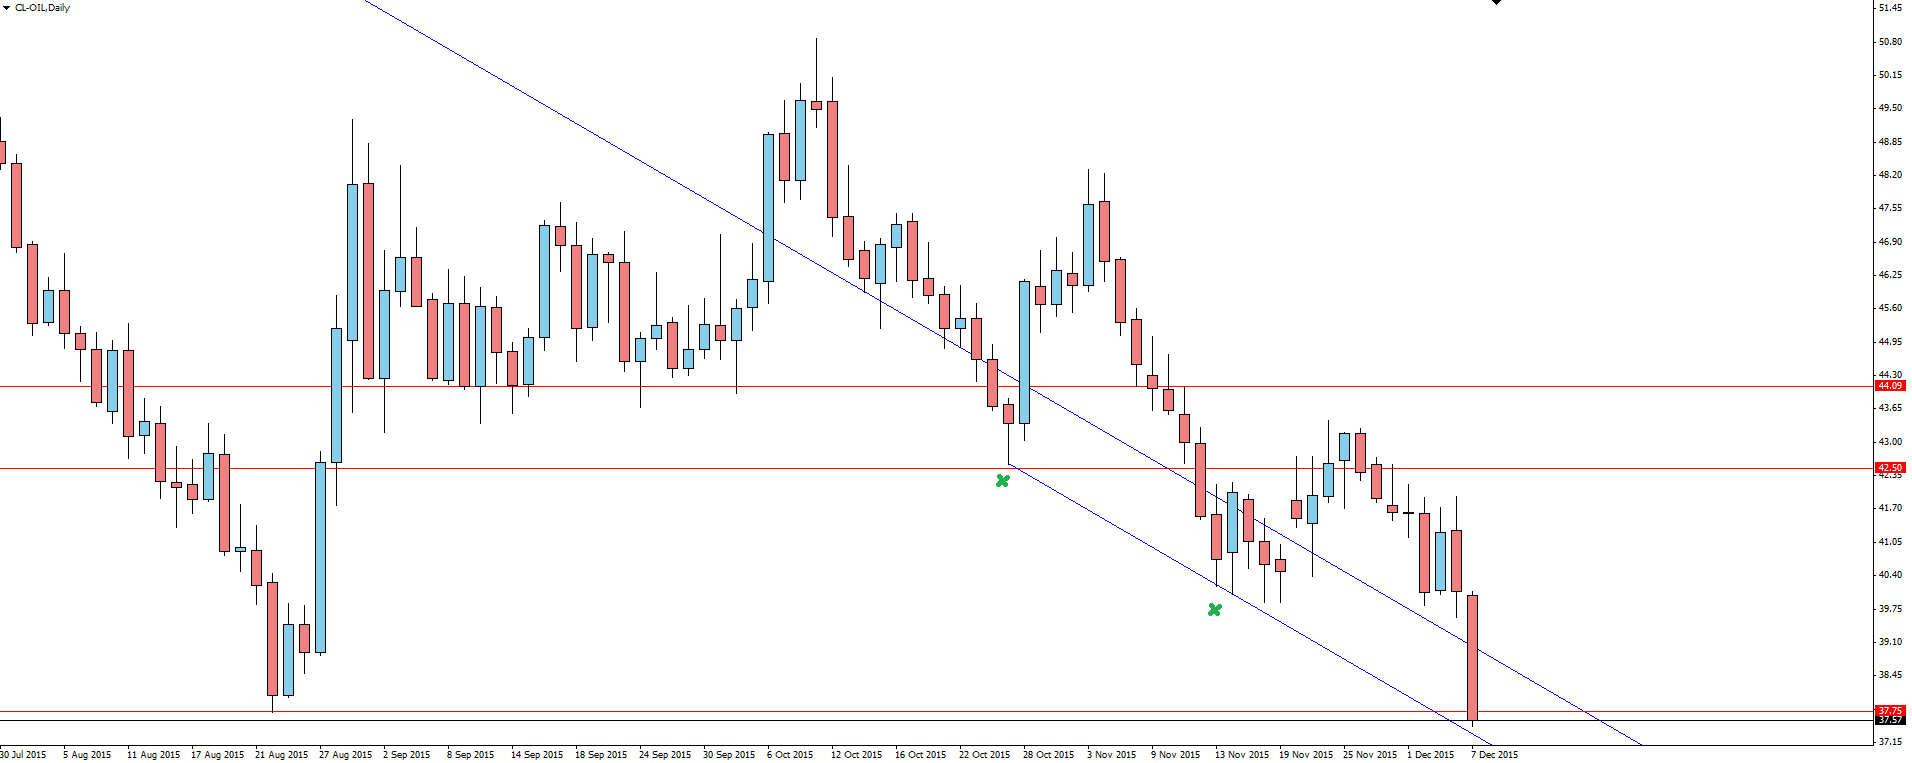
The second daily chart just shows a simple parallel drawn from the major trend line above, but set to line up with some of the short term bottoms. The fact that this level lines up perfectly with the previous swing bottom at 37.75 gives oil a nice confluence of support of which could give bulls their last stand.
With commodities all taking a sizeable hit overnight, do you see opportunity trading these markets?
Risk Disclosure: In addition to the website disclaimer below, the material on this page prepared by FX Broker Vantage FX Pty Ltd does not contain a record of our prices, or an offer of, or solicitation to trade. All opinions, news, research, analysis, tools, prices or other information is provided as general market commentary and marketing communication – not as investment advice. Consequently any person opening a trading account and acting on it does so entirely at their own risk. The experts writers express their personal opinions and will not assume any responsibility whatsoever for the actions of the reader. We always aim for maximum accuracy and timeliness, and STP Forex Broker Vantage FX shall not be liable for any loss or damage, consequential or otherwise, which may arise from the use or reliance on this service and its content, inaccurate information or typos. No representation is being made that any results discussed within the report will be achieved, and past performance is not indicative of future performance.
