- As we step into February, a traditionally challenging period for stocks, it's prudent to explore key ratios that could hint at changes in market sentiment.
- The strengthening US dollar, surpassing the crucial 102 level, could hint at a potential reversal for risk assets like stocks.
- Meanwhile, other key ratios reveal emerging divergences, indicating potential declines and a rotation toward defensive stocks.
- In 2024, invest like the big funds from the comfort of your home with our AI-powered ProPicks stock selection tool. Learn more here>>
The period from November to January historically favors equities, and this trend has persisted this year as well.
However, with the end of this strong-performing period, is it reasonable to anticipate some weakness in equities?
It's crucial to emphasize the imprudence of going against the prevailing trend, even though such contrarian thinking is not uncommon.
While it might challenge some of our strategies, it's essential to remain vigilant and not let it sway our bullish market outlook, at least in the short term.
We are stepping into February which is historically considered one of the more challenging periods for stocks, especially in election years. And, stocks tend to face difficulties in the first quarter.
In this piece, we will examine a set of key ratios that might help us gauge if a change in sentiment is looming.
1. High-Beta Vs. Low-Beta Stocks
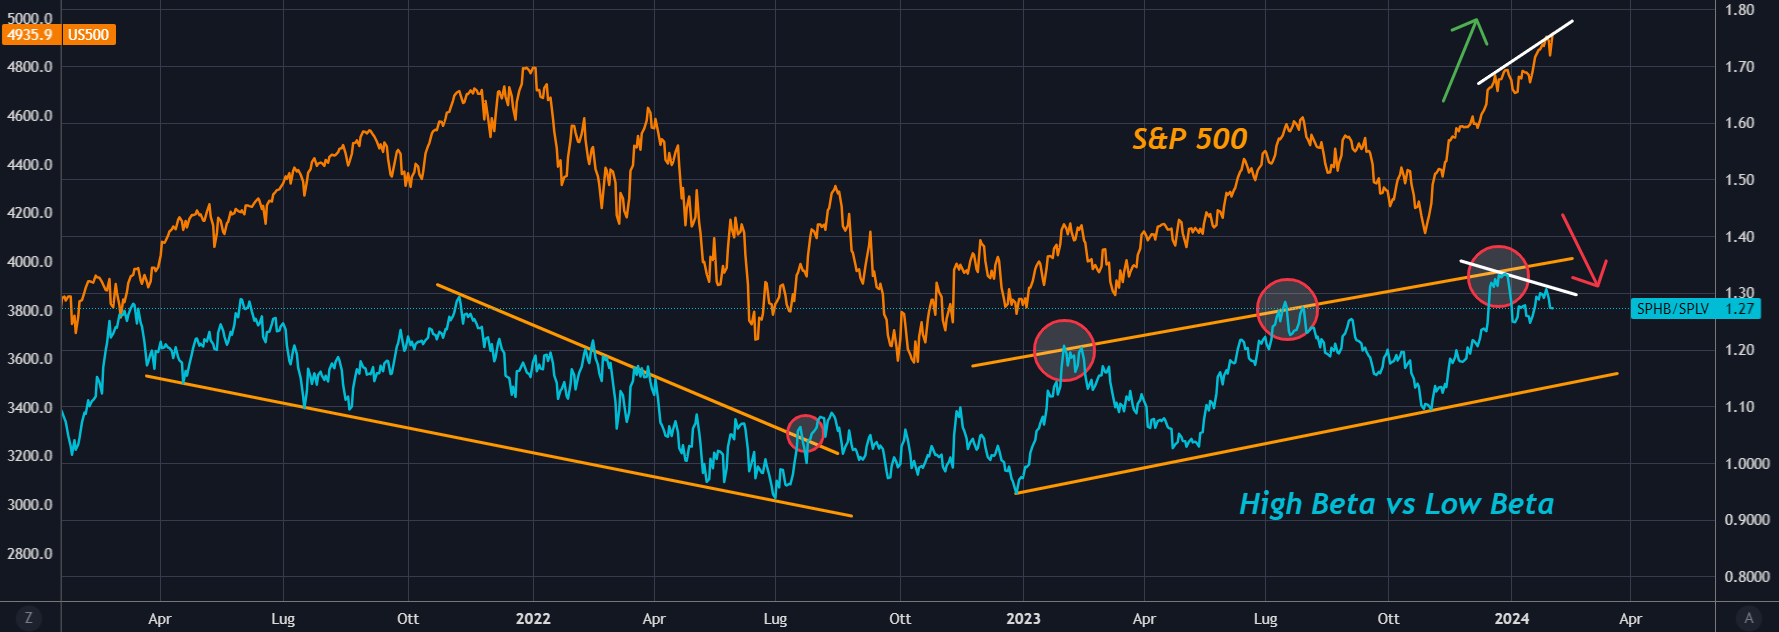
Let's start with the ratio of high-beta stocks (NYSE:SPHB) to low-beta stocks (NYSE:SPLV).

Since November 2021, low betas have gained favor, coinciding with the retracement of the S&P 500.
Subsequently, a trend reversal occurred, marked by high beta stocks breaking the descending triangle, aligning with a positive 2023 for the S&P 500 and achieving new all-time highs.
Currently, the ratio favors risky assets, but the channel formed over the past year suggests a potential downward trend in the coming weeks.
This is reinforced by the divergence between the U.S. index, reaching new highs, and the ratio, exhibiting declining highs.
A correction in a bull trend, including a potential reversal in the S&P 500, would be considered normal.
2. DXY Vs. S&P 500: US Dollar Gains in January
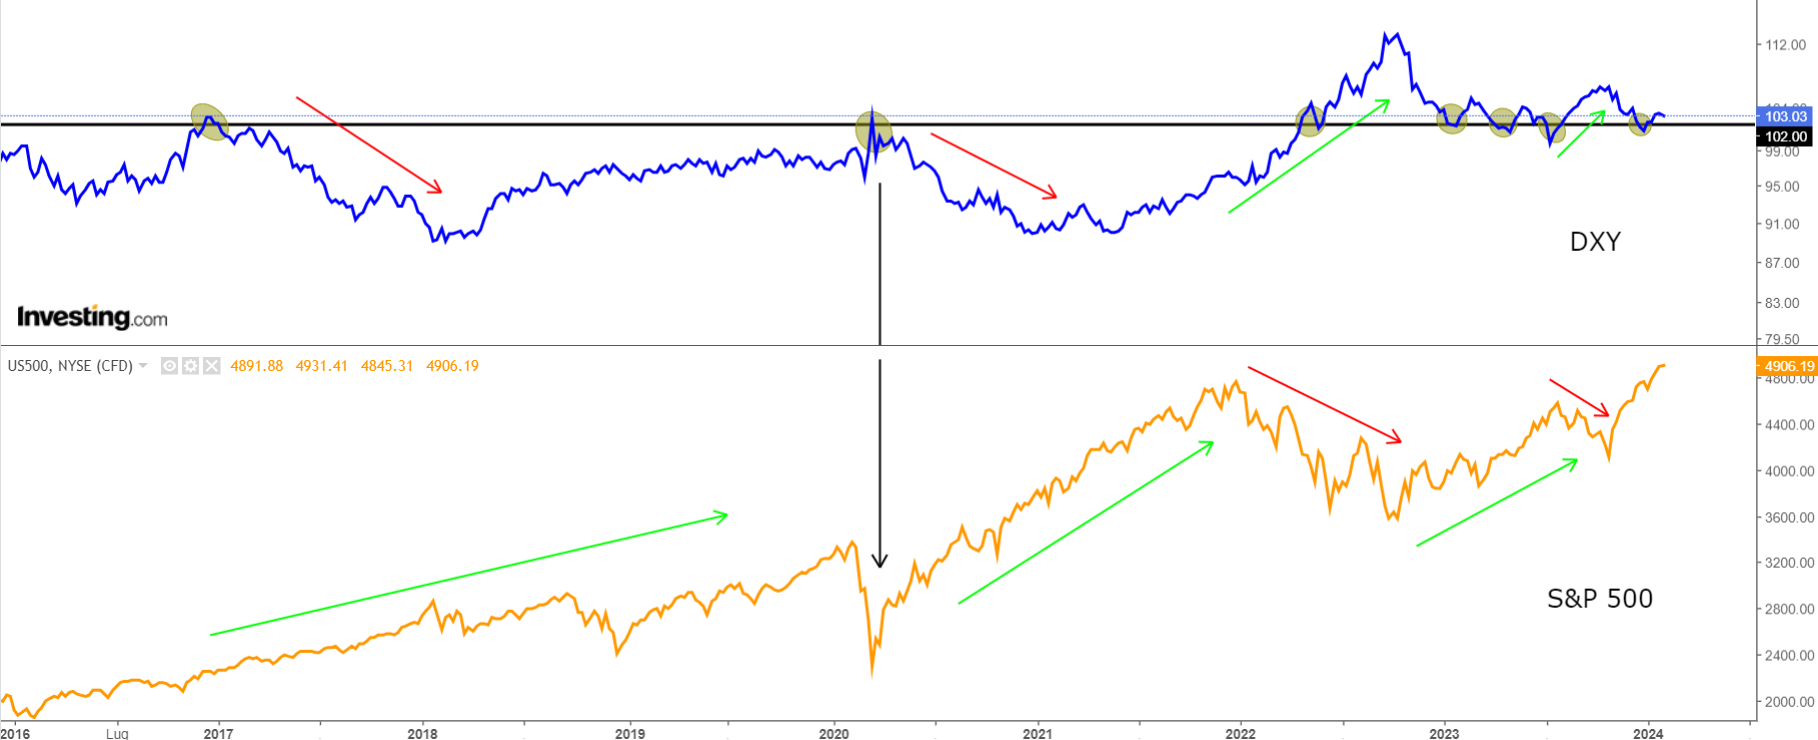
Currently, the US dollar index is strengthening, surpassing the 102 level and indicating a potential shift in the market dynamics unfavorable to the bulls. 
Historical analysis reveals that this level serves as a crucial threshold between bullish and bearish trends, especially concerning the S&P 500.
When the dollar maintains stability above this point, equities often experience a reversal to the downside.
3. High Yield Corporate Bonds Vs. S&P 500
Possible declines are corroborated by the stocks of unstable and struggling companies.
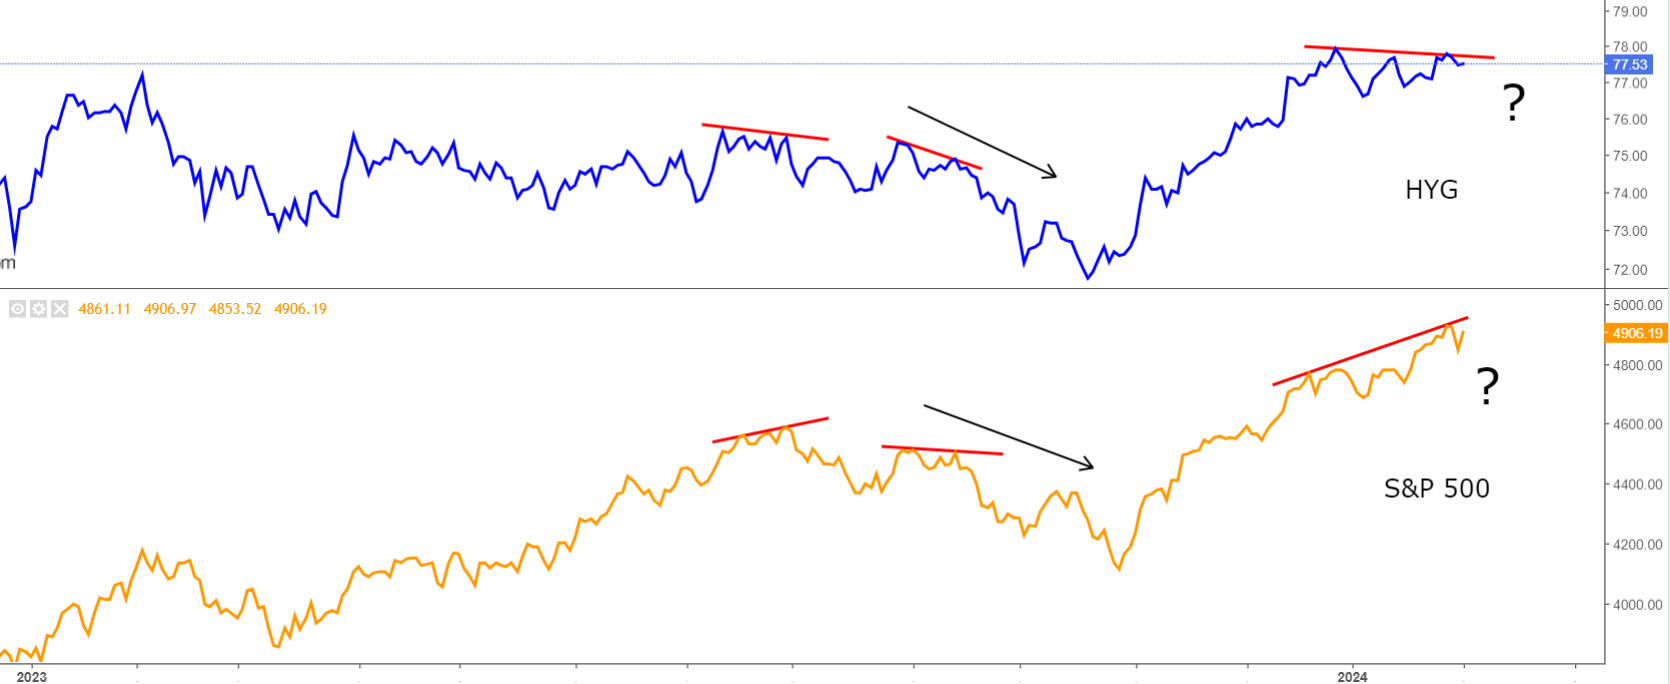
When there is fear and volatility, investors typically dump these stocks first. We can observe this from the High Yield Corporate Bond ETF's (NYSE:HYG) comparison to S&P 500.

Observing the chart, we are still at a calm level, but a divergence with the S&P 500 has emerged, impacting equities in recent months.
The decisive bearish factor is the rotation toward defensive stocks.
4. XLP Vs. S&P 500
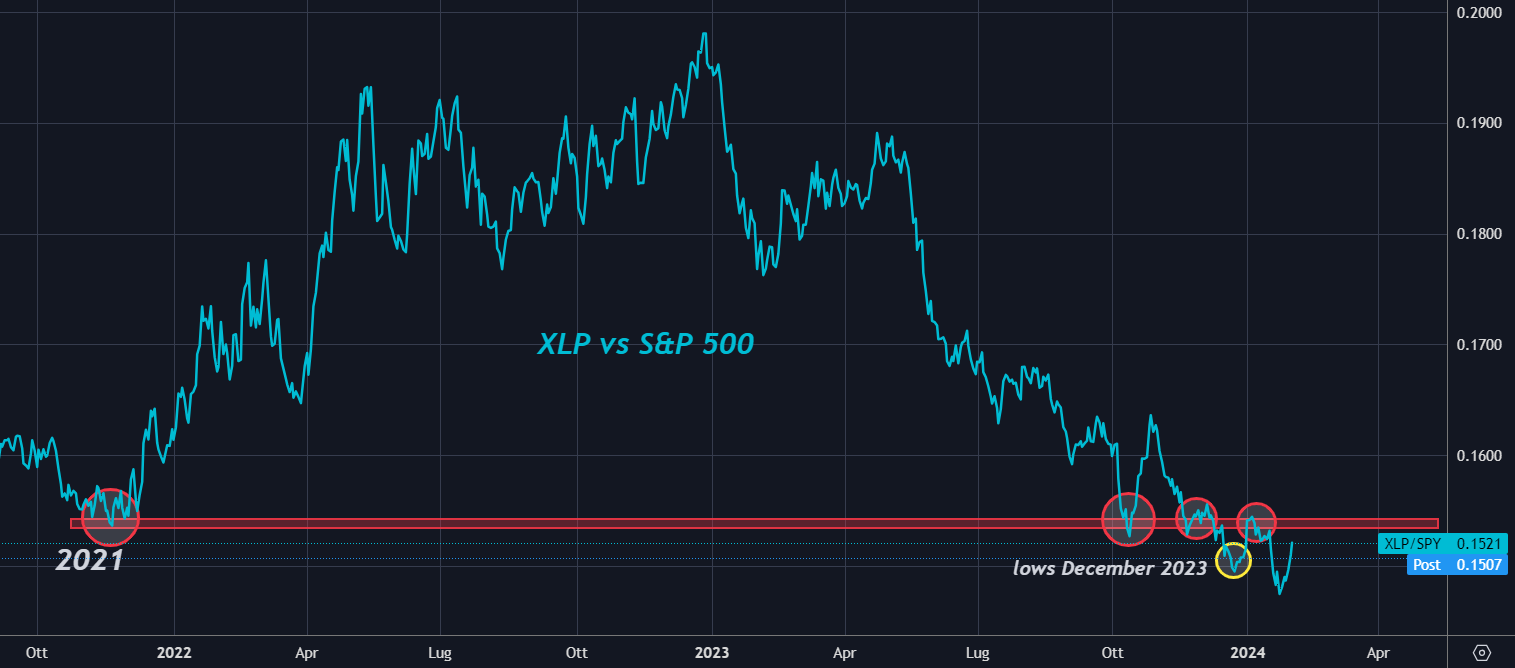
If we seek trend reversals and assess the market's risk appetite, the Consumer Staples (NYSE:XLP) to S&P 500 ratio provides clear information.

The ratio currently supports a bullish sentiment, steadily declining even in this early part of the year.
It has dropped below the 2021 lows, except for the last few days when it rose above the December 2023 lows, favoring defensive stocks.
February might prove to be a decisive month for identifying reversals.
***
Take your investing game to the next level in 2024 with ProPicks
Institutions and billionaire investors worldwide are already well ahead of the game when it comes to AI-powered investing, extensively using, customizing, and developing it to bulk up their returns and minimize losses.
Now, InvestingPro users can do just the same from the comfort of their own homes with our new flagship AI-powered stock-picking tool: ProPicks.
With our six strategies, including the flagship "Tech Titans," which outperformed the market by a lofty 952% over the last decade, investors have the best selection of stocks in the market at the tip of their fingers every month.
Subscribe here for up to 50% off as part of our year-end sale and never miss a bull market again!
Don't forget your free gift! Use coupon code pro2it2024 at checkout to claim an extra 10% off on the Pro yearly and by-yearly plans.
Disclaimer: This article is written for informational purposes only; it does not constitute a solicitation, offer, advice, or recommendation to invest as such it is not intended to incentivize the purchase of assets in any way. I would like to remind you that any type of asset, is evaluated from multiple points of view and is highly risky and therefore, any investment decision and the associated risk remains with the investor.

