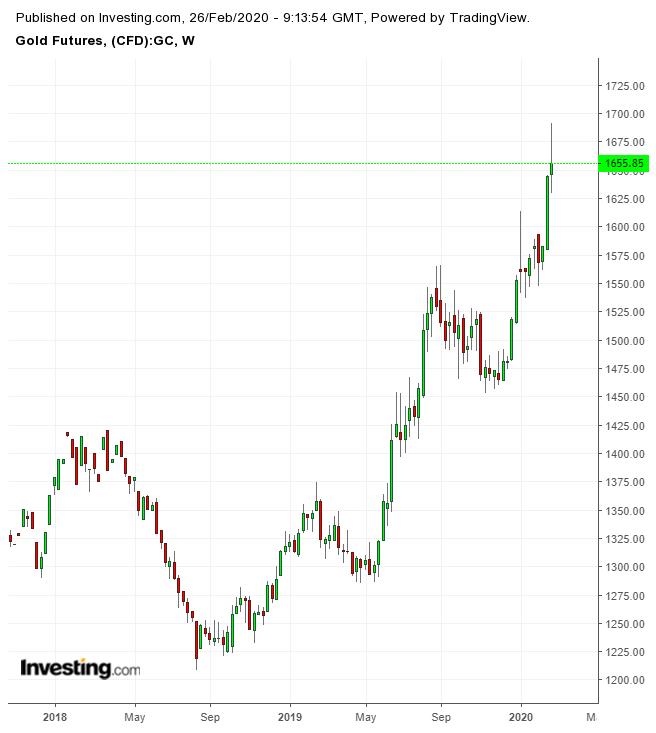
Short sellers in stocks weren’t the only ones celebrating when the “most-hated bull market in history” was coming apart on Tuesday. On the other side of the aisle, gold was also getting hammered, delighting naysayers who’d warned that everyone’s favorite safe-haven could crash too.
It’s one thing when a stock market that has rallied beyond a decade melts down on worry that the coronavirus could soon be coming at the United States like never before — the Centers for Disease Control and Prevention said on Tuesday it’s a matter of when, not if, for the Covid-19 to become a U.S. pandemic.
But it’s another thing to see one of the most popular hedging tools used by investors against that health crisis falling along with other markets, when logic dictates that it should rise. Gold’s near 2% loss on Tuesday — coming after the Dow, S&P 500 and Nasdaq all slumped almost 3% each — appeared to cast the yellow metal out like any risk asset.

Gold Was “Off The Charts,” Reversal Necessary
Gold’s slump came after analysts at TD Securities noted that longs in the yellow metal had entered new territory of “dry-powder positioning,” which it said was “off the charts” and could trigger a reversal.
“The risk of a near-term pullback is as high as it's ever been,” the analysts at TD Securities cautioned.
Yet, some view Tuesday’s retreat as a necessary pivot for gold, that allowed it to pause sharply the first time after a three-week run-up with few interruptions. That rally had tacked some $115 on the market and lifted it to seven-year highs that saw gold futures peaking at $1,691 per ounce and bullion at $1,689.
In Wednesday’s Asian trade, U.S. gold futures hovered at $1,645 — not far from where it settled the previous day but back in the green.
Latecomers To Gold Party Shaken Out
Analysts say the previous day’s breakdown shook out most of the latecomers to the gold party — particularly those who belong to the “FOMO,” or Fear-of-Missing-Out crowd.
Now, technically strengthened, the yellow metal looks poised to take on the target that really matters next to the remaining longs in the market — $1,700.
“A large amount of fast money was going long at the top on Monday morning, only to have spent most of yesterday being squeezed out to the downside,” Jeffrey Halley, analyst at OANDA, said, observing the action in gold over the past 48 hours.
He adds:
“The culling of the FOMO traders, while pleasing, appears to have run its course. We may well have seen the lows for gold for the week now, as fundamentals reassert themselves. The landscape is undeniably positive for gold as stocks and yields fall and worries about global growth persist.”
So, what do the technicals tell now of gold and its attempt toward $1,700?
“Gold prices appear to have found initial technical support around the $1,635 level and 23.6% Fibonacci retracement of the commodity’s most recent bullish leg,” said Rich Dvorak, a technical analyst for both currencies and precious metals. “This area may have potential to keep bullion buoyed going forward before a retest of the $1,600 price level might be considered.”
$1,700 In View; Getting There Takes Work
But if gold doesn’t succumb to another selloff, then its immediate challenge would be the near-side technical resistance of $1,660, said Dvorak.
“If it can top around $1,660, gold might look poised to continue pressing higher toward the $1,700 handle, before 2012 highs come into focus."
Analysts at Eagle FX say gold’s hourly chart bears heavy watching for the trends and pitfalls in its path toward $1,700.
“While the recovery from the overnight low of $1,625 is encouraging, the metal is yet to challenge the falling channel resistance at $1,647,” the brokerage said in a note, referring to early Wednesday’s moves in Asia.
“An hourly close above that level would imply an end of the pullback from recent highs near $1,690, and would shift risk in favor of a rise to $1,660 (a lower high on the hourly chart).”
