- Stocks rallied on slim hopes of relaxed lockdowns, economic recovery
- Yields reverse back to all-time lows
- First Chinese economic contraction in decades
With markets betting on a rebounding economy as the national conversation shifts from the pandemic itself to the possibility of easing lockdown restrictions and the arrival of a treatment for COVID-19, U.S. stocks extended their rally a second week—for a total of 3 weeks out of 4.
The S&P 500 climbed for a second week, gaining 3%, its longest advance since the market peaked in mid-February. As such, and as we've noted before, we’ve changed our position from bearish to bullish, albeit grudgingly.
Thin Hopes vs. Hard Reality
To be clear, not only are we hesitant to maintain a bullish stance, we're irritated by it. Investors are currently buying up stocks, pushing equity indices back toward their record high on thin hopes, while ignoring the hard facts. Currently there are more than 2,330,000 cases of COVID-19 globally, with close to 161,000 fatalities. The U.S. with more than 735,000 confirmed cases remains the immediate epicenter for the disease.
Yet stocks are rallying on promises the Fed and U.S. government will be able to prop up the country's economy with fiscal stimulus and monetary policies, even as the political narrative says scientists along with the pharmaceutical industry will rapidly find a vaccine or drug to stop the pandemic.
The hard reality is somewhat different, however: these same drug makers clearly indicate a quick cure is not a forgone conclusion and optimistic dates for the arrival of a vaccine aren't a certainty either. Such unrealistic promises are similar to what occurred in the 1980s, during the HIV and AIDS epidemic. 35 years later there's still no vaccine nor a cure, though there are antiretroviral treatments that can control the virus—but it took years for these to be developed.
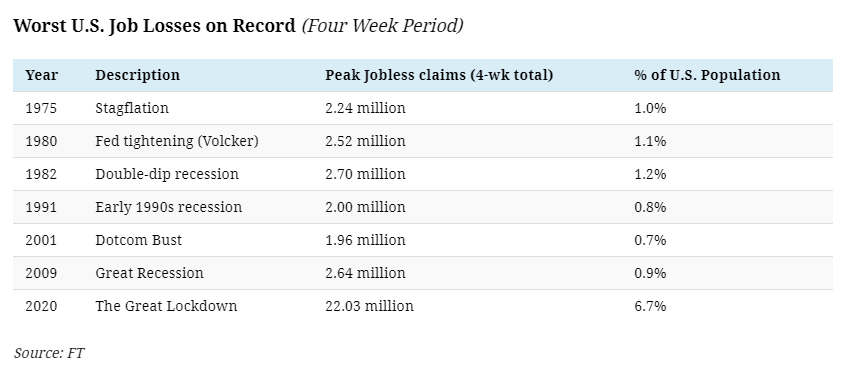
At the same time, we have solid and alarming data making the case for a recession. Jobless claims surged for the third straight week, with 5.2 million Americans applying for assistance in just the past week, bringing the total of recently unemployed to 22 million, erasing the same number of jobs created since March 2009, sending what could perhaps be regarded as an ominous signal.
It's the worst loss of jobs since the Great Depression, eclipsing anything seen over the past 4.5 decades:
That's not all. Retail Sales fell more than 8% in March, 16% annually, and Housing Starts were simply ravaged. The world’s second largest economy, China, shrank 6.8% in the first quarter from a year ago.
Will America see a similar contraction? Yes. Of course, there's an argument to be made that this is only a temporary problem, since the economy was solid beforehand. Our answer: at this juncture we have no idea just how temporary this problem may be. Remember, a cure for AIDS has never been found, notwithstanding years of promises.
Nevertheless, having judged investors as impulsive, we recognize that the trend remains higher. Therefore—grudgingly—we expect stock prices to continue higher, until, if and when they top out. And never fear, we'll remain vigilant. As soon as a top appears we'll let everyone know.
U.S. Major Indices All Rally But Yields Drop
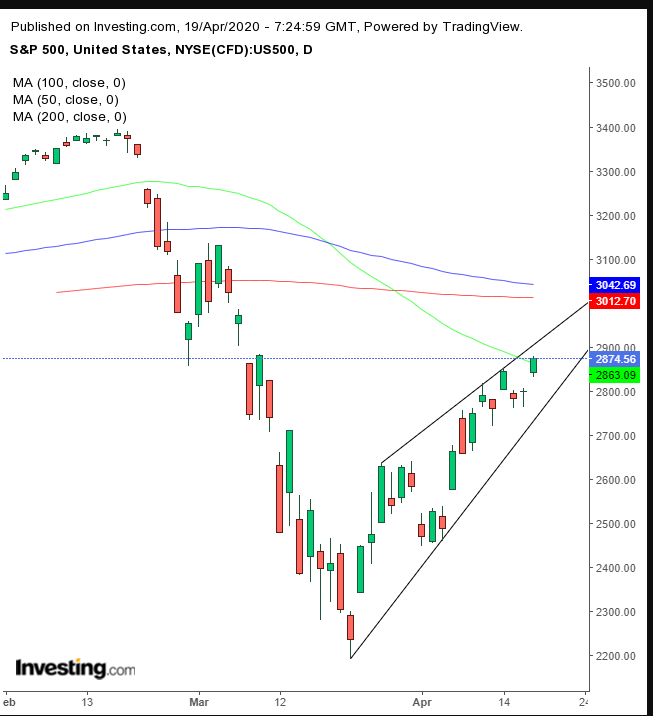
So far, the S&P 500 Index rebounded 28.5% from the March 23 bottom, after falling 33.9% from the Feb. 19 top. On Friday, the SPX closed above the 50 DMA, for the first time since the benchmark gapped below it on Feb. 24.
On the other hand, it's possible index is developing a rising wedge, bearish after the preceding, COVID-19 selloff. We’re in a tricky environment right now, as the entire wedge constitutes a bullish reversal of over 20%. Still, let’s see which way the price will break out. Note, the pattern’s climax can be around the 200 DMA at the psychological, round 3,000 level.
The other major indices didn’t fare as well, from a technical perspective.
While the Dow Jones Industrial Average surged 30.5% from its March 23 bottom—more than the S&P 500, it also suffered an earlier and greater preceding loss, 37.1% from the Feb. 12 peak. The mega cap index's Friday was below its 50 DMA. Like the SPX, the Dow, too, may be developing a rising wedge.
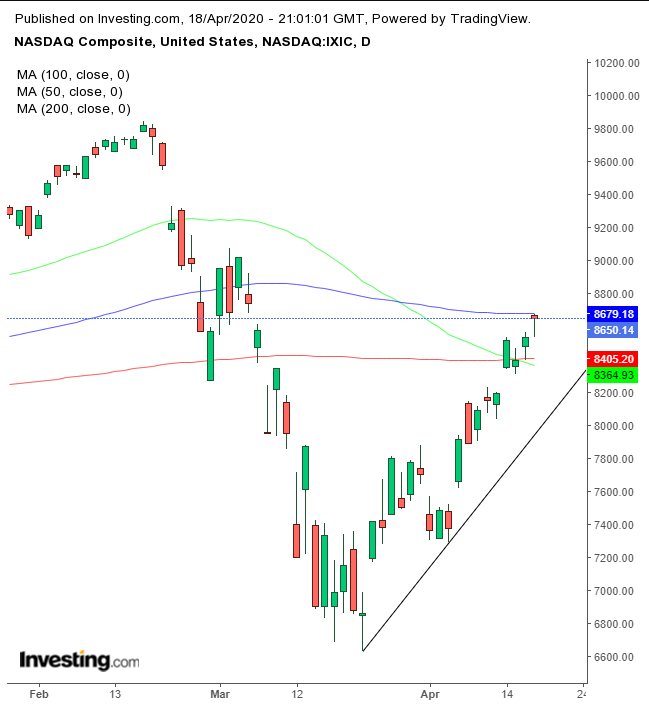
The NASDAQ Composite trailed the other large cap indices, gaining just 26.1% since its March 23 bottom, after its 30.1% drop from the Feb. 19 record. While the tech-heavy index already traversed not only its 50 and even 200 DMAs, that was not enough to stop a Death Cross. As well, the index 'hit its head' below the 100 DMA and was forced to close below it, forming a hanging man. If Monday’s close is lower, it will have provided a sell signal, at least on a pullback.
The small cap Russell 2000 underperformed on the rebound from its March 23 bottom, gaining 24.3%—even after its considerably earlier peak on Jan. 16, from which it dropped more than any of the other major U.S. benchmarks, shedding 42% of value. Furthermore, it is the only one among the major-four that declined for the week (-1.4%).
Despite the week's equity rally, yields, including for the 10-year Treasury, dropped to the lowest level since April 3, in a two-day decline that separates rates from the lowest level since the March 8 bottom.
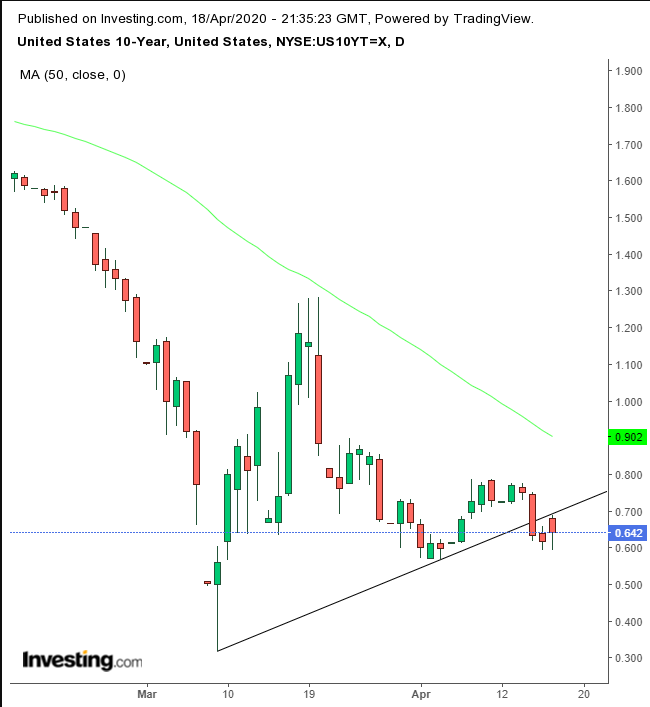
Technically, yields fell below their uptrend line since the lowest intraday level of March 9. If we consider the 50 DMA a fair downtrend line, the downward penetration of the uptrend line might be regarded as a downside breakout of a symmetrical triangle, which—following a downtrend—signals a continued fall.
The dollar trimmed some of last week’s losses, crossing above its downtrend line since the March 19 peak.
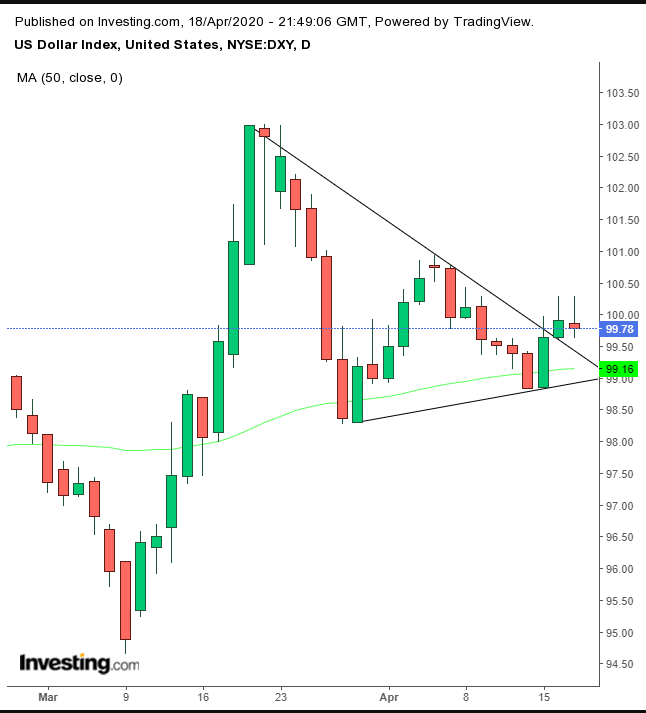
From a technical perspective, the USD may have completed a pennant, bullish after its preceding 8.5% gain in only 10 days, from March 9 through March 19. Note how the 50 DMA traces the pattern bottom, a mirror image of yields.
Gold futures dropped, pressured by both risk-on and dollar strength.
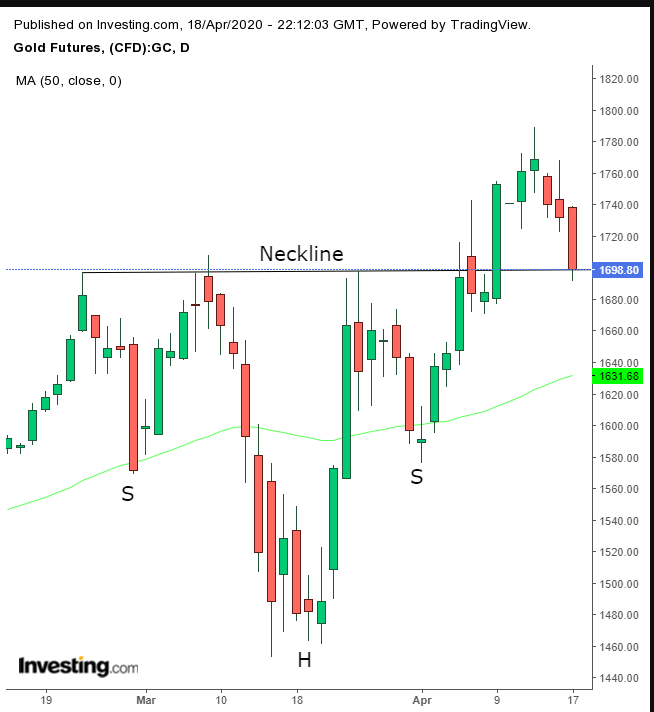
However, the precious metal found precise support by the neckline of a beautifully symmetrical H&S bottom, suggesting it completed a return move to retest the bullish pattern and is now ready to bounce back toward the $2,000 mark.
WTI fell for the seventh week out of eight as Saudi Arabia reportedly doubled its exports to the U.S. amid a market share grab via a price war.
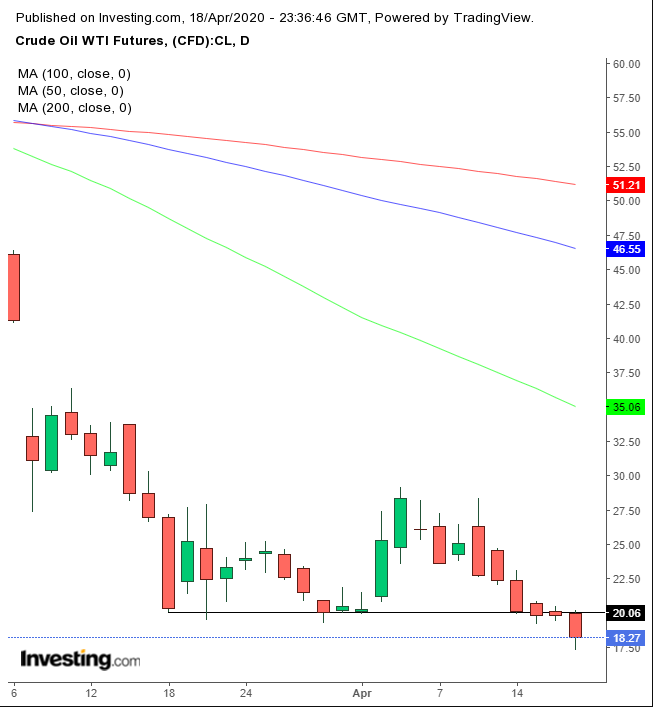
Friday’s 8%+ crude collapse, after China's GDP release showed the world's biggest oil importer had experienced its first economic contraction in decades, took the commodity toward $18. Technically, the previous support of $20, the price floor since March 18, has become a ceiling of resistance.
The Week Ahead
All times listed are EDT
Sunday
21:30: China – PboC Loan Prime Rate: a rate cut is widely anticipated after Friday's GDP release signaled the dire effects of the coronavirus outbreak.
Monday
2:00: Germany – PPI: a contraction to -0.7% is forecast.
Tuesday
5:00: Germany – ZEW Economic Sentiment: likely ticked up to -41.0 in April from -49.5 in March.
8:30: Canada – Core Retail Sales: expected to jump to 0.3% from -0.1%.
10:00: U.S. – Existing Home Sales: seen to continue to decline to 5.30M from 5.77M.
Wednesday
2:00: UK – CPI: probably edged lower to 1.5% from 1.7% YoY.
8:30: Canada – CPI: likely slipped to -0.4% in March, from 0.4% previously.
10:30: U.S. – Crude Oil Inventories: forecast to plunge to 11.676M from 19.248M.
Thursday
2:00: UK – Retail Sales: expected to have plummeted to -3.8% from -0.3%.
3:30: Germany – Manufacturing PMI: anticipated to fall deeper into contraction territory, to 39.0 from 45.4
8:30: U.S. – Initial Jobless Claims: after the past few weeks' dreadful numbers, this release will be closely watched.
10:00: U.S. – New Home Sales: seen to decline to 645K from 765K.
Friday
2:00: UK – Retail Sales: expected to contract further, to -4% from -0.3%.
4:00: Germany – Ifo Business Climate Index: likely to fall to 80.0 from 86.1.
6:30: Russia – Interest Rate Decision: anticipated to remain at 6.00%.
8:30: U.S. – Core Durable Goods Orders: likely to have plunged to -6.0% from -0.6%.
