- December set to be the deadliest month of 2020 as COVID escalates globally
- Stimulus package may be approved Sunday, potentially boosting Monday's US market open
- Dollar steadies
All four major US averages—the S&P, Dow, NASDAQ and Russell 2000—notched new records last week, though each closed lower on Friday. Equities on Wall Street dropped during the final day of trade when Congress once again was unable to reach an agreement on fiscal stimulus.
That risk, however, may no longer be in play in the coming week as reports broke}} late Saturday night that senators had "struck a late-night compromise to clear one of the final hurdles," to a new, $900 billion coronavirus fiscal aid package, and that voting could take place Sunday to finally authorize the stimulus. Should this occur, markets would likely start the week on an up-note, compounded by optimism on the rollout of additional vaccines across the US and the world.
Still, an array of other geopolitical risks could continue to roil markets and drive volatility in the coming week. Among the headwinds: additional US sanctions—announced Friday—against dozens of Chinese tech firms including chipmaker SMIC (HK:0981) and privately-held drone manufacturer SZ DJI Technology China, returning the Sino-US trade war to the forefront; stalled Brexit negotiations ahead of the Sunday deadline and the coronavirus continues to ravage the US and Europe as the global case count has topped 75 million infections worldwide.
Quadruple Witching; Potentially Bearish Technicals
US equities dropped on Friday but Tesla (NASDAQ:TSLA) shares extended a record amid heavy volume ahead of the electric carmaker being added to the S&P 500 on Monday. The broad benchmark ended a three-day advance as it closed out the week.
However, quadruple witching, the quarterly expiration of options and futures on stocks and indices, created a flood of volume that pushed stocks well off their lows. Nonetheless, Friday’s trading still formed a potentially bearish pattern.
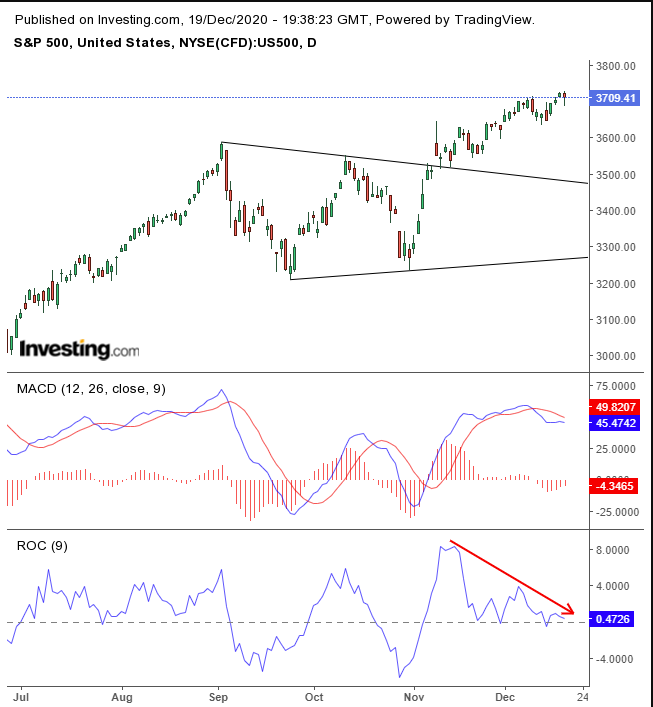
Friday’s price action developed a hanging man, bearish with a confirmation—a close below the hanging man’s real body or closing price. The MACD’s short MA already fell below the long MA and the ROC has been providing a negative divergence. After achieving half the preceding symmetrical triangle’s implied target, it may be time for a pullback.
Tesla surged 6% on Friday, gaining 11.6% over its two-day rally, with nearly 200 million shares trading hands. That's four times the 30-day average for the stock, as funds benchmarked to the S&P 500 adjusted holdings to include the Palo Alto, California-based electric auto manufacturer ahead of the company's inclusion on the SPX. This was the highest volume of trade for the stock since Feb. 4. The stock has skyrocketed this year, vaulting 731% higher as of Friday's close.
As well, some analysts are forecasting additional upside for the stock which, as of Monday, will become the top performing S&P stock by a wide margin. This should add to its already robust momentum.
Technicals concur. The supply-demand balance is pointing higher.
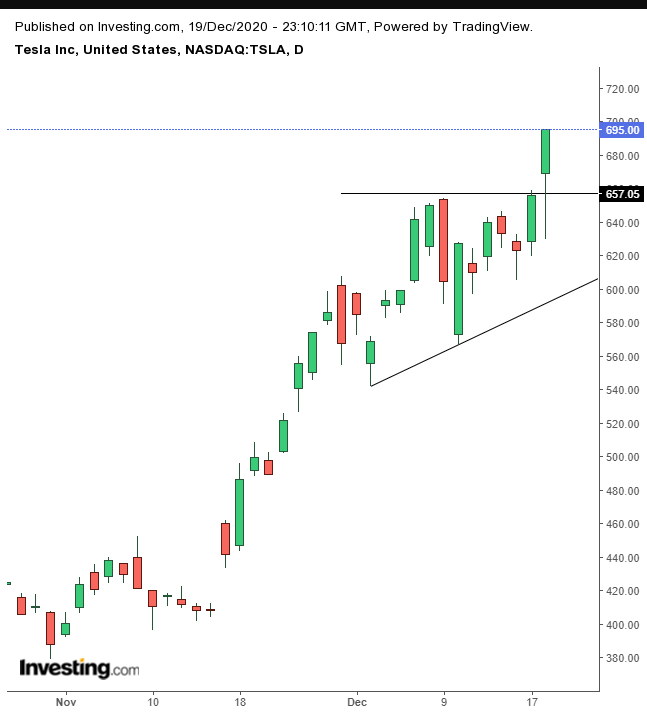
The volume on the upside breakout of a pennant pretty much guarantees a heavy rollout of the continuation pattern. This should take the stock to $750.
Quiet Before The Storm?
Economic data was mixed last week, revealing that the recovery is losing some steam amidst rising virus cases and renewed lockdown restrictions. The weakness in retail sales and the recent slowdown in jobs growth as well as the uptick in initial claims, which reached the worst levels since September, weighed on investor sentiment.
While stocks may have recorded new all-time highs last week, their rate of ascent has eased as economic data reflected a slower recovery, as well as the cyclical year-end, holiday market environment.
In truth, with so many moving parts now in play, it's difficult to know whether the US economy will take off, continue sideways for a while, or contract yet again. Over the short-term, monetary and fiscal policy can continue to support the economy, kicking the can down the road. But without growth fueled by real gains, the economy could end up running on funny money and the mammoth debt would eventually have the potential to explode the system.
Yields, including for the 10-year Treasury note, climbed on Friday, for a fourth straight day.
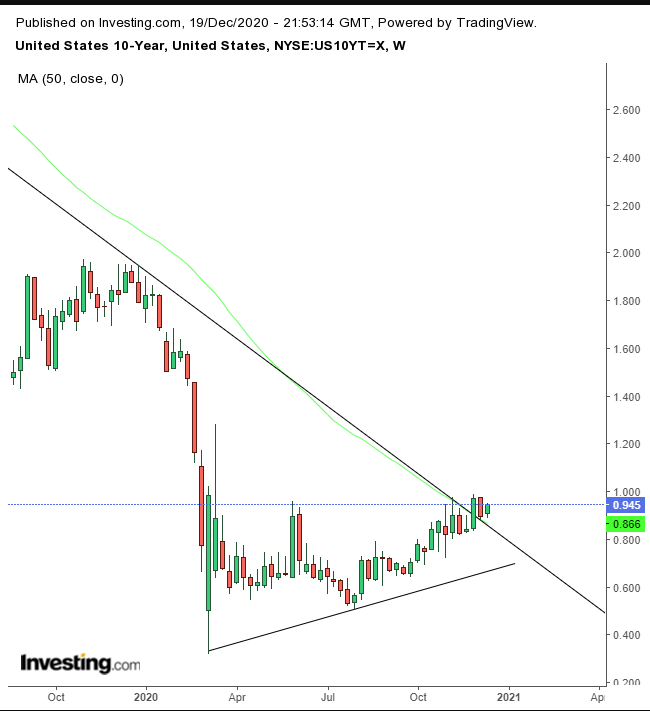
Rates bounced off the long-term downtrend, reinforced by the 50-week MA, in place since the November 2018 high, after breaching it two weeks earlier.
The recent, steeper dollar selloff provided traders a buying dip on Friday.
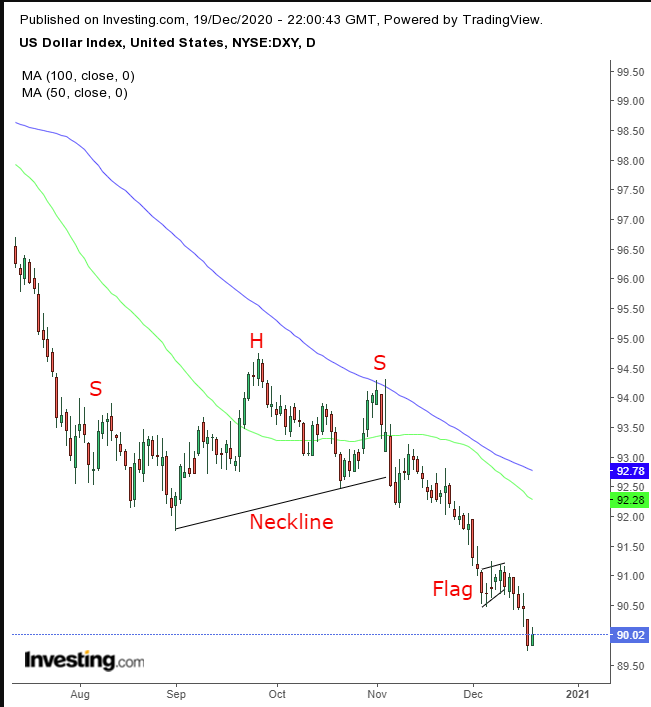
From a technical perspective, a strengthening dollar would be considered normal market mechanics, as the greenback executes a return-move to the bearish flag, following a H&S continuation pattern. The 100 WMA, after providing resistance to the H&S, forced the 50 DMA lower.
Gold retained almost all its gains on Friday, despite the stronger dollar, probably due to its safe haven status on a day when equities sold-off.
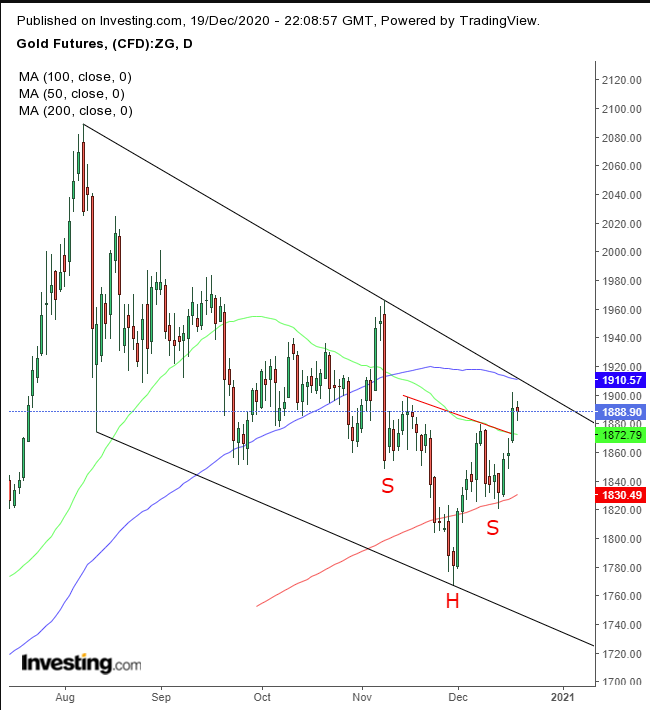
The precious metal bounced off the bottom of a falling channel and nearly reached its top. At the same time, it completed a small H&S. However, we would feel more comfortable making a bullish call on this after an upside breakout of the channel.
Bitcoin popped on Friday jumping 3.5% to hit yet another record for the soaring cryptocurrency. It was the digital token's eighth advance in a row, for a total 32.6% gains—in, we'll say it again, just eight days.
Oil accelerated on Friday, rising 1.5%, climbing for the fifth straight day for a total of 5.4% over the course of the week. WTI also logged its seventh straight weekly gain, +37.2%.
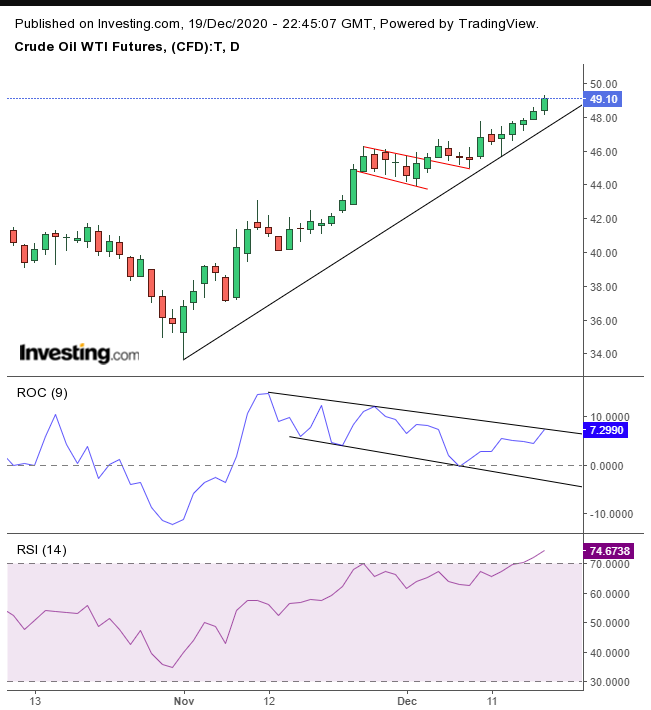
Crude almost realized its flag’s implied target, and the RSI neared the 75 over-sold level, the most extended for the commodity since April 2019. The ROC reached the top of its falling channel.
The Week Ahead
All times listed are EST
Sunday
19:30: Australia – Mid-Year Economic and Fiscal Outlook is released.
20:30: China – PBoC Loan Prime Rate: expected to remain steady at 3.85%
Monday
19:30: Australia – Retail Sales: seen to drop to -0.6% from 1.4% previously.
Tuesday
2:00: UK – GDP: forecast to remain flat at 15.5% QoQ and -9.6% YoY.
8:30: US – GDP: predicted to have leaped to 33.1% from -31.4%.
10:00: US – Existing Home Sales: believed to have slipped to 6.70M from 6.85M.
Wednesday
8:30: US – Initial Jobless Claims: to edge higher to 900K from 885K.
8:30: Canada – GDP: expected to fall to 0.2% from 0.8% MoM.
10:00: US – New Home Sales: probably dipped to 990K from 999K.
10:30: US – Crude Oil Inventories: anticipated to jump to -1.937M from -3.135M.
Thursday
8:30: US – Core Durable Goods Orders: seen to decline to 0.6% from 1.3%.
Friday
Australia, Canada, Eurozone, Hong Kong, Mexico, New Zealand, South Africa, UK, US
Christmas Day Holiday
