- Selloffs have no new fundamental catalyst but could be technical
- All four US benchmarks registered short-term downtrends
- VIX fell despite selloff
- Dollar threatens reversal, while gold toys with traders
After a volatile week during which all four main US indices—the Dow Jones, S&P 500, NASDAQ and Russell 2000—were pressured lower for a second week, and with no single catalyst for the turnaround in market sentiment, we're expecting similar activity in the week ahead.
The dual week downward trajectory was the first time this has occurred since April, with technology stocks bearing the brunt of the selling. That's left the NASDAQ Composite roughly 10% off its all-time-high, achieved just six sessions ago. Investors seem to have abruptly realized that valuations are simply too high, and that they've been paying full price, if not more so, while uncertainty remains at extraordinary levels.
Herd Mentality Driving Markets?
So what changed from just weeks ago when markets reached all-time highs, climbing higher for eight out of nine weeks? How is it that investors bought stocks, then without warning sold them off almost in unison.
To be fair, skepticism about a compromise on a coronavirus stimulus package ahead of the election and signs of a slowing recovery in the labor market have all contributed to the negative sentiment. But isn’t it strange that the reversal occurred so abruptly, as if there was a sudden consensus on the matter?
To be fair, the politicization of coronavirus relief isn't new, and the decelerating labor market isn't a surprise either. All of these factors have been brewing for a while. Could it have been a coincidence?
Hardly. What we are seeing is the essence of herd mentality.
First, it was a pack of bulls, driven by the Greater Fool Theory. Everyone knew prices weren't a bargain, and there have been more than enough reports on how many things can go wrong—with the pandemic; with the US or European relationship with China; with the broken energy market, the unstable dollar, yields remaining near record lows; social unrest across the country ahead of what promises to be acrimonious elections potentially adding to the nation's polarization. In short, there's plenty of risk that could weigh on markets.
In our view, the smart money knew they were buying a hot potato, hoping to pass it on to less savvy investors before their own hands were burned. Indeed, those holding onto stocks in the last two weeks got scorched.
Are we flip-flopping from our newly declared bullish stance of last week after having remained obstinately bearish amid the miraculous recovery since the March bottom?
Not at all. In that post, we also warned that though we're skewing bullish, because we must move with the flow of the trend, we remain as cautious as ever, since none of the risk caused by the fastest bear market in history and the worst recession since the Great Depression has been alleviated.
We still have no vaccine. As well, we don’t know whether it’s even possible to vaccinate against a virus that continues to mutate, making a definitive cure elusive. There is also the ongoing claim that it is impossible to distribute the vaccine in an effective manner, which could mean most of the world won’t receive it.
We’ve consistently said we're going err on the side of caution until there's a solid reason to behave otherwise. Maybe in a different world where people always wear masks and remain at home we'd see another stage in the current evolution of what's normal and the economy would adapt. However, till we see evidence of that, we will assume that the worst global pandemic in more than a hundred years is bad for the economy.
We noted up top that there was no known fundamental reason why markets suddenly reversed into risk-off now. But there may have been a technical catalyst: remember this Broadening Formation on the SPX which we noted in July 2019? We could be seeing it triggering again now:
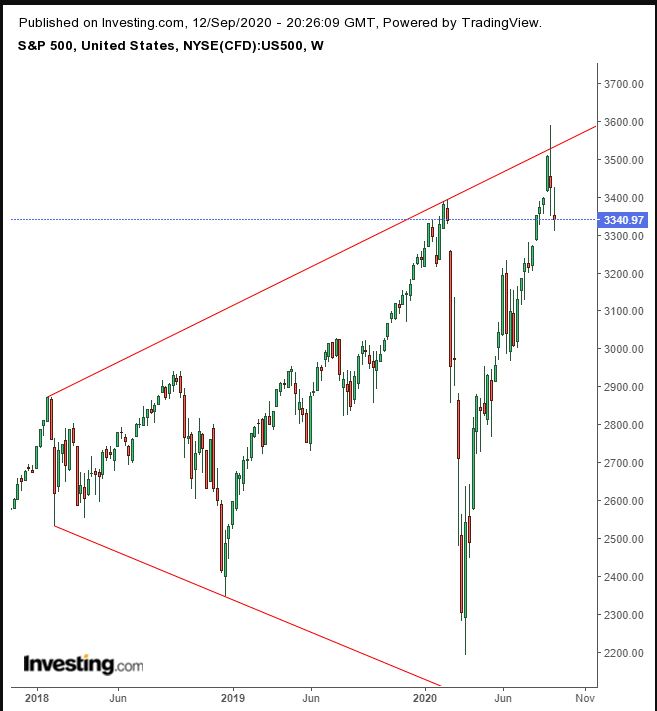
The current selloff began after the price tested the top of a broadening pattern, where prices provide a mixed message. While the highs go higher, suggesting a more bullish picture, the lows go lower, demonstrating a more complex reality.
According to classic technical analysis literature, this pattern tends to develop at tops when fearful investors begin the first wave of selling, driven by panic. Sounds familiar?
However, the presumed dynamics of the pattern occur over months, while this pattern, which started in January 2018, has been in progress for three years. So, we can’t be sure whether investors remember and are responding to the chart.
Nevertheless, it's still interesting that the biggest selloff since March occurred after stocks attempted to break through the pattern.
Meanwhile, on the daily chart, it's clear the benchmark established a short-term downtrend.
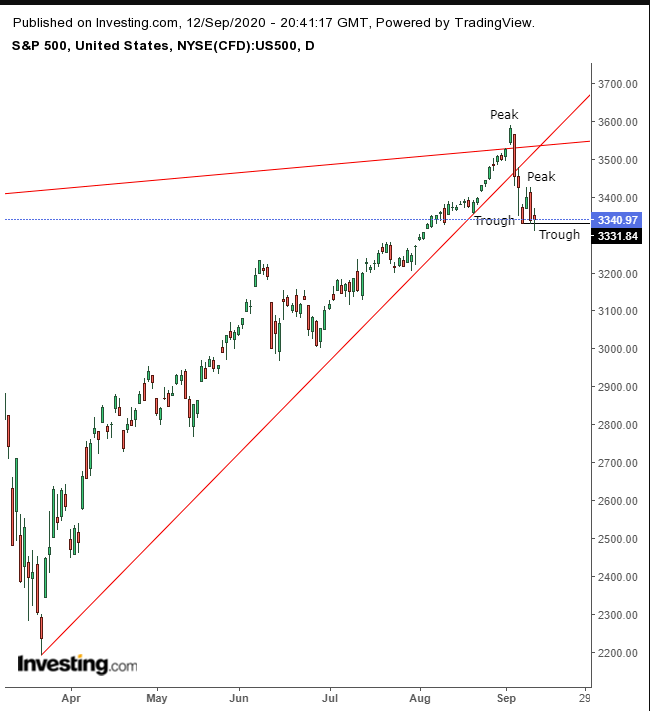
The SPX fell 258.84 points from its Sept. 2 record-peak, establishing a peak and a trough; then, the price rebounded 96.28 points within three sessions, establishing the second trough; completing the minimum required two peaks and troughs in a downward formation to establish a short-term downtrend, while the long-term uptrend remains intact.
Of interest, though, is that volatility declined, even as all four major US gauges dropped.
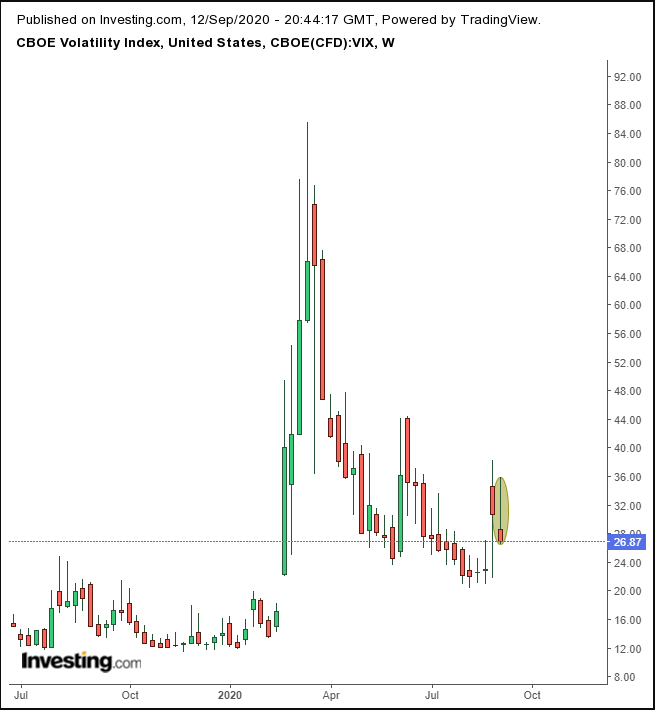
This suggests investors are betting on equities actually rising.
Yields, including for the 10-year Treasury note, continued to trade along a H&S top.
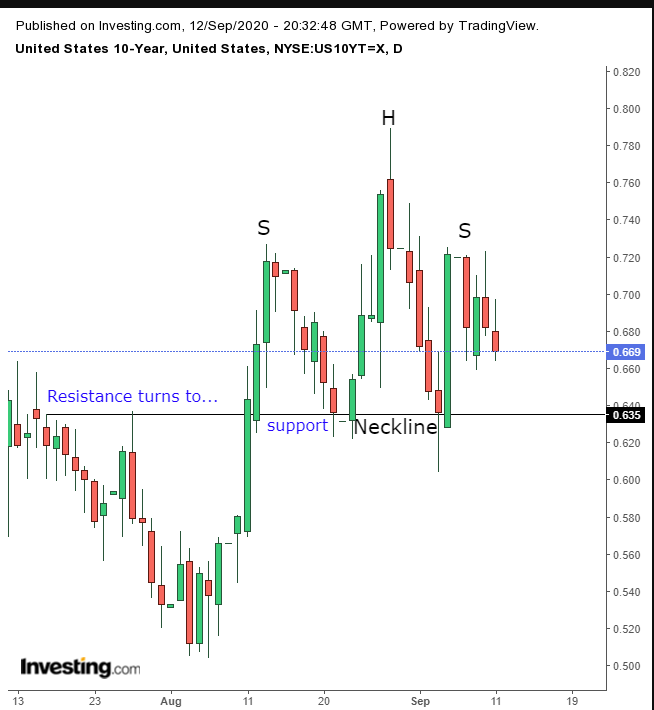
In the opposite signal from equities, this conveys a bearish view of markets.
The dollar has been retesting the trendline that traces its highs since late July, and has met the top of a falling channel since mid-May.
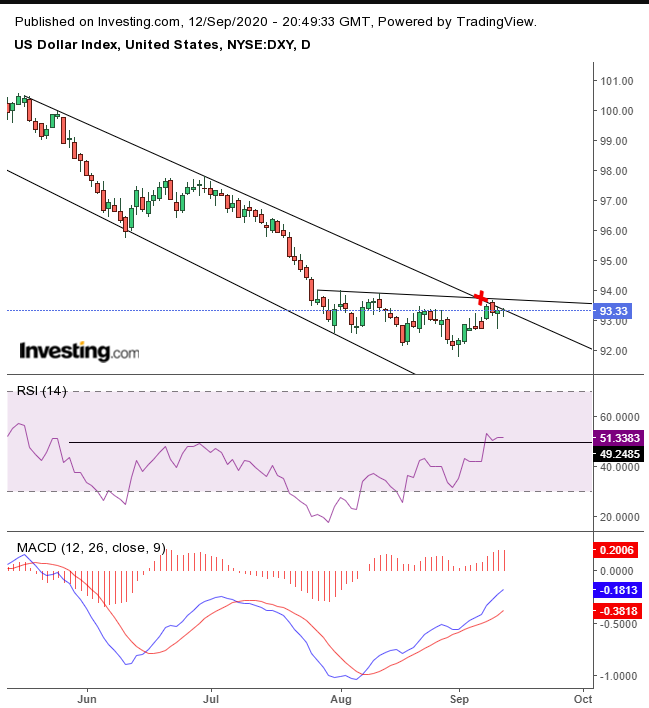
Both RSI and MACD are indicating that the USD may break the 34 level, indicating it's bottoming out.
Gold's lethargy has been toying with investors’ nerves.
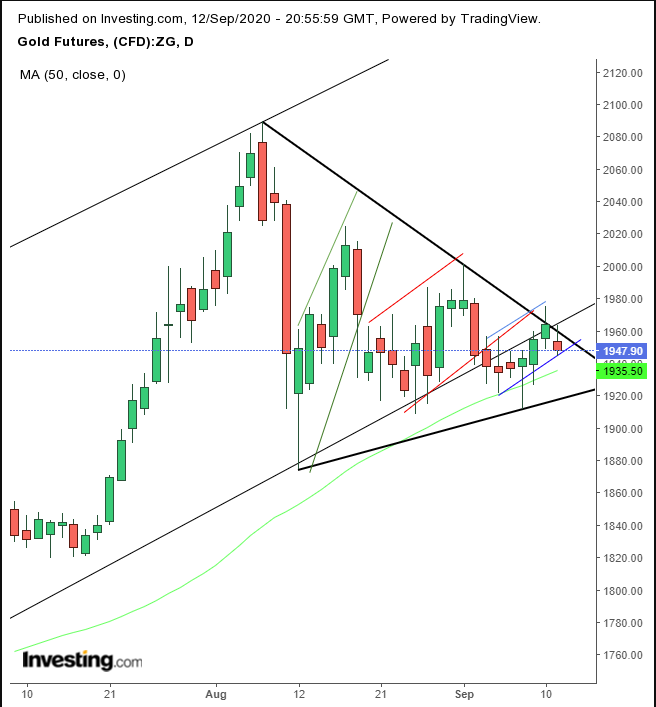
The precious metal has been developing a pennant, a bullish continuation pattern within a rising channel, while forming three consecutive repeated rising flags, bearish after preceding down-moves.
Bitcoin moved higher on Saturday, for a fourth straight session.
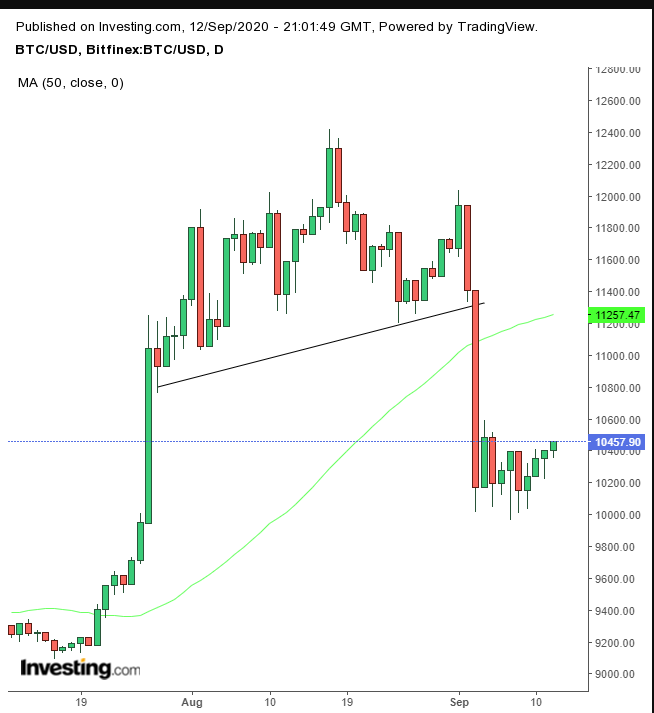
The cryptocurrency did this after ten days earlier completing a H&S pattern, whose minimum implied target had been achieved on its first day of the breakout, falling as much as 12.25% and closing 10.85% lower.
Oil demand is in danger once again as the peak US driving season comes to an end.
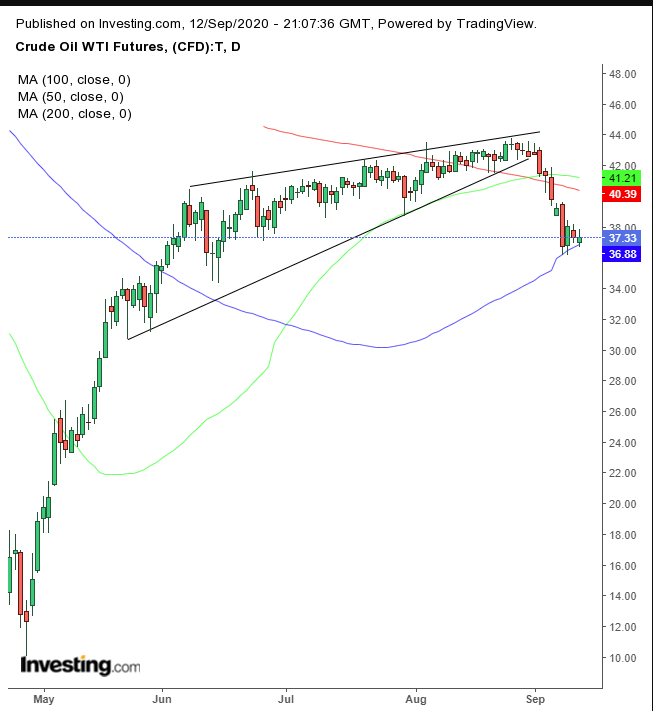
WTI has been stalling for a third day, supported by the 100 DMA, as it looks to be developing a continuation pattern, bearish after the preceding fall that completed a rising wedge, which is bearish as well, after the dramatic rise from -$40 territory to +$40 levels.
The Week Ahead
All times listed are EDT
Monday
21:30: Australia – RBA Meeting Minutes
22:00: China – Industrial Production: expected to edge up to 5.1% from 4.8%.
Tuesday
2:00: UK – Average Earnings Index + Bonus: seen to fall slightly, to -1.3% from -1.2%
2:00: UK – Claimant Count Change: previously printed at 94.4K.
5:00: Germany – ZEW Economic Sentiment: probably stepped back to 69.8 from 71.5.
Wednesday
2:00: UK – CPI: consensus expects a drop to 0.1% from 1.0%.
8:30: US – Core Retail Sales: predicted to decline to 0.9% from 1.9%.
8:30: US – Retail Sales: forecast to retreat to 1.0% from 1.2%.
8:30: Canada – Core CPI: likely to have fallen to -0.2% from -0.1% previously.
10:30: US – Crude Oil Inventories: previous reading was 2.032M.
14:00: US – Fed Interest Rate Decision: expected to remain at 0.25%.
14:30: US – FOMC Statement
21:30: Australia – Employment Change: anticipated to plummet to -50.0K from 114.7K
Thursday
3:00: Japan – BoJ Press Conference
5:00: Eurozone – CPI: seen to hold at -0.2% YoY.
7:00: UK – BoE Interest Rate Decision: likely to have stayed at 0.10%.
7:00: UK – BoE MPC Meeting Minutes
8:30: US – Building Permits: expected to have risen to 1.510M from 1.483M previously.
8:30: US – Initial Jobless Claims: disappointed last week by falling to 884K.
8:30: US – Philadelphia Fed Manufacturing Index: seen to have receded to 15.5 from 17.2.
Friday
2:00: UK – Retail Sales: probably plunged to 0.7% from 3.6%.
6:30: Russia – Interest Rate Decision: forecast to be cut to 4.00% from 4.25%.
8:30: Canada – Core Retail Sales: expected to drop to 0.5% from 15.7%
