Another earnings season has started. Financial shares, especially banks, usually receive the most attention in the first days of quarterly reporting. But many other widely followed companies are also reporting this week.
They include Chipotle Mexican Grill (NYSE:CMG), Freeport-McMoRan (NYSE:FCX), International Business Machines (NYSE:IBM), Johnson & Johnson (NYSE:JNJ), LM Ericsson (NASDAQ:ERIC), Netflix (NASDAQ:NFLX), NextEra Energy (NYSE:NEE), Nucor (NYSE:NUE), Southwest Airlines (NYSE:LUV), Verizon Communications (NYSE:VZ) and others.
Recent research by Qi Sun of California State University San Marcos highlights, the "stock price discovery process is distorted in earnings season.” Broader markets also often witness volatility spikes. Many investors keep a close eye on the CBOE Volatility Index (VIX), which is also known as the “fear-gauge."
Since January, the VIX has been declining and is now hovering at 16.2. However, if metrics from several of the darlings of Wall Street were to disappoint, that could easily pick up again soon.
Meanwhile, the Dow Jones Industrial Average, the S&P 500 and the NASDAQ 100 have hit record highs in recent days. Year-to-date (YTD), they are up around 11.7%, 11.4% and 8.9%, respectively. Given these significant increases, many market participants wonder if there could be some short-term profit-taking around the corner, especially if there were negative earnings surprises from a number of Wall Street favorites.
Navigating periods of increased volatility can feel unnerving. However, via diversification and having a long-term approach, investors could find it easier to manage risk.
Today's article introduces two exchange-traded funds (ETFs) that might appeal to readers who want to diversify their portfolios in the coming weeks.
1. Schwab Emerging Markets Equity ETF
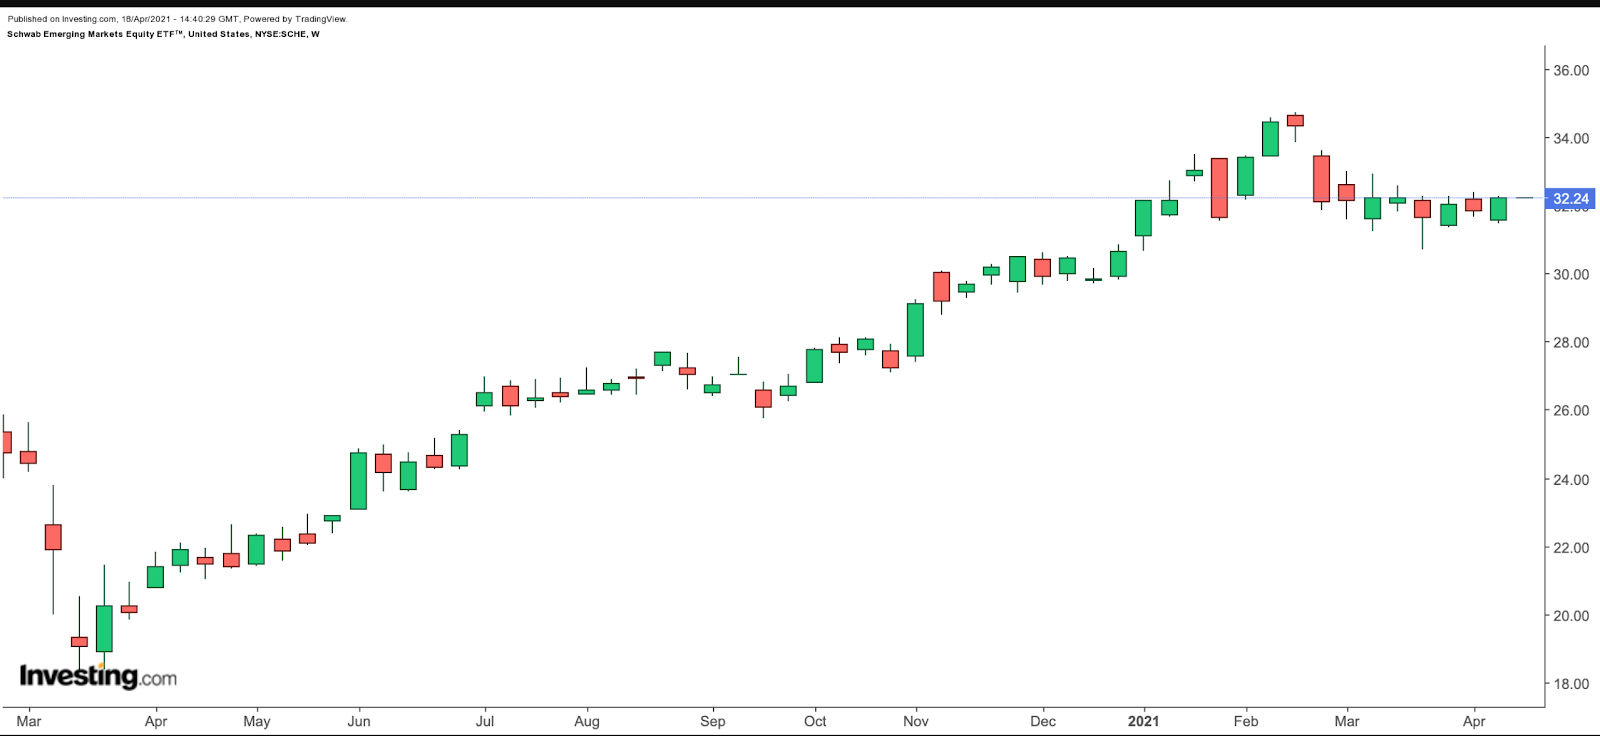
- Current Price: $32.24
- 52-week range: $18.32 – $34.74
- Dividend yield: 1.99%
- Expense ratio: 0.11% per year
Our first fund takes us outside US borders. The Schwab Emerging Markets Equity ETF™ (NYSE:SCHE) invests in large capitalization (cap) and mid-cap emerging market firms. Chinese companies have the highest weighting (44.0%), followed by Taiwan (15%), India (10.97%), and Brazil (6.24%). The fund started trading in January 2010.

SCHE, which tracks the FTSE Emerging Index, has 1,638 holdings. The top 10 names comprise around 27% of net assets of $9.2 billion. Among the leading sectors are financials (20.07%), consumer discretionary (18.52%), and IT (15.37%).
The world's largest chip foundry Taiwan Semiconductor Manufacturing (NYSE:TSM) tops the roster. Next in line are China-based social-media heavyweight Tencent (OTC:TCEHY), e-commerce and cloud computing group Alibaba (NYSE:BABA) and food-delivery platform Meituan (OTC:MPNGF). South African internet group Naspers (OTC:NPSNY) and India-headquartered multinational conglomerate Reliance Industries (NS:RELI) are also among the leading names.
YTD, the fund is up 5%. Trailing P/E and P/B ratios are 18.97 and 2.15, respectively. In the case of potential profit-taking, long-term investors would find better value below $30.
A large number of analysts are bullish on the long-term prospects of emerging markets, which tend to have higher growth rates than those achieved by many developed economies. For instance, in the first quarter of 2021, China's economy grew by a record 18.3%, compared with the same period of 2020. Other emerging nations could also see a robust economic rebound in the rest of the year. Therefore, the globally diversified nature of this low-cost fund could appeal to a range of investors.
2. iShares Morningstar Multi-Asset Income ETF
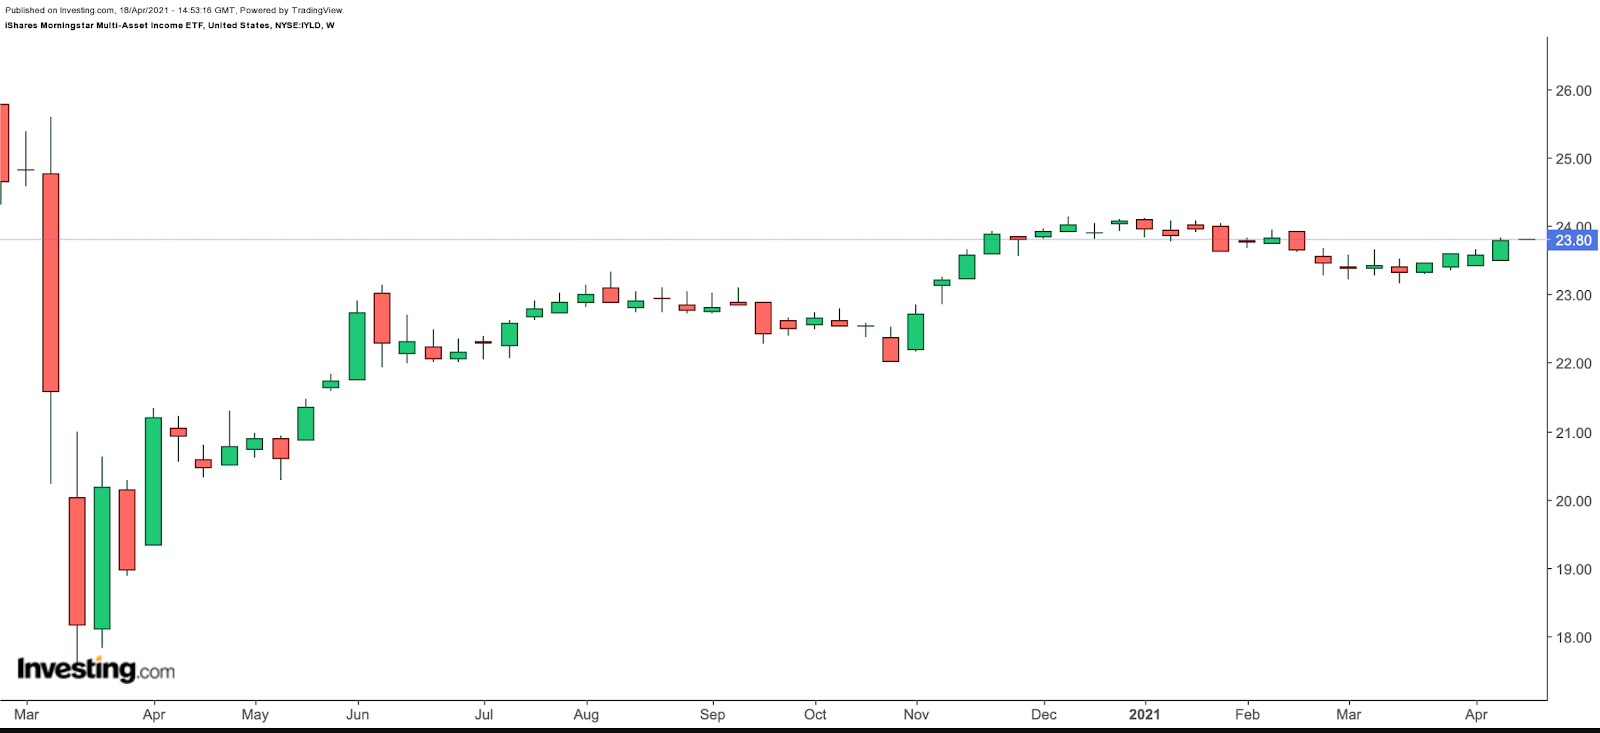
- Current Price: $23.80
- 52-week range: $20.29 - $24.13
- Dividend yield: 3.85%
- Expense ratio: 0.60% per year
The iShares Morningstar Multi-Asset Income ETF (NYSE:IYLD) provides exposure to different asset classes, including bonds (60%), equities (20%) and alternative income sources (20%). The fund aims to achieve high current income as well as some capital appreciation.

IYLD, which started trading in April 2012, tracks the Morningstar Multi-Asset High Income Index. With 11 holdings, its net assets are close to $250 million.
A detailed inspection of the holdings shows an investment in other iShares ETFs run by BlackRock, which has around 800 ETFs globally and close to $2 trillion in assets under management.
The top five names in IYLD make up over 75% of the ETF. They include:
- iShares iBoxx $ High Yield Corporate Bond ETF (NYSE:HYG)
- iShares Preferred and Income Securities ETF (NASDAQ:PFF)
- iShares 20+ Year Treasury Bond ETF (NASDAQ:TLT)
- iShares 10-20 Year Treasury Bond ETF (NYSE:TLH)
- iShares International Select Dividend ETF (NYSE:IDV)
IYLD further invests in government bonds issued by emerging market countries, the US mortgage real estate sector, dividend-paying US stocks, and emerging market equities.
Since the start of the year, IYLD is down 1.1%. Its composition could make it an appropriate fund for passive income seekers such as retirees.
