
USDCNH US dollar to offshore Chinese yuan
Recently, the USD/CNH has risen for 4 consecutive trading days and is currently hovering around 6.98408. The U.S. dollar index , which tracks the greenback against six major peers, rose 0.7% on Thursday to hold steady at 102.05 after global data showed a slowdown in the world's largest economy. Lead to the weakening of energy and risk currencies, and the weakening of risk currencies will lead to the strengthening of the US dollar index.
In a sign of low confidence, the latest data showed that credit issuance in China fell sharply month-on-month last month after strong growth in the first quarter, with household lending contracting for only the fifth time since records began.
Data released yesterday by the People's Bank of China showed that new yuan-denominated loans fell 80% to 718.8 billion yuan ($103.4 billion) in April from March, but rose 10% year-on-year.
Household loans, which refer to mortgages and other forms of credit extended to individuals, fell by 241.1 billion yuan ($34.7 billion). This is only the fifth decline in personal loans since statistics are available, following February 2019, February 2020, February 2022 and April 2022.
The decline in household lending was largely due to lower property purchases after rising in March, suggesting subdued demand and weak confidence remained. The government should continue to make credit easier for homebuyers, such as by reducing down payments and lending rates.
Commodities also fell overnight on bearish economic indicators and renewed concerns over a post-credit China recovery New loans fell MoM in April. At the same time, as China is one of Australia's major export countries, weak economic data also led to a fall in the Australian dollar.
Weekly Chart - USDCNH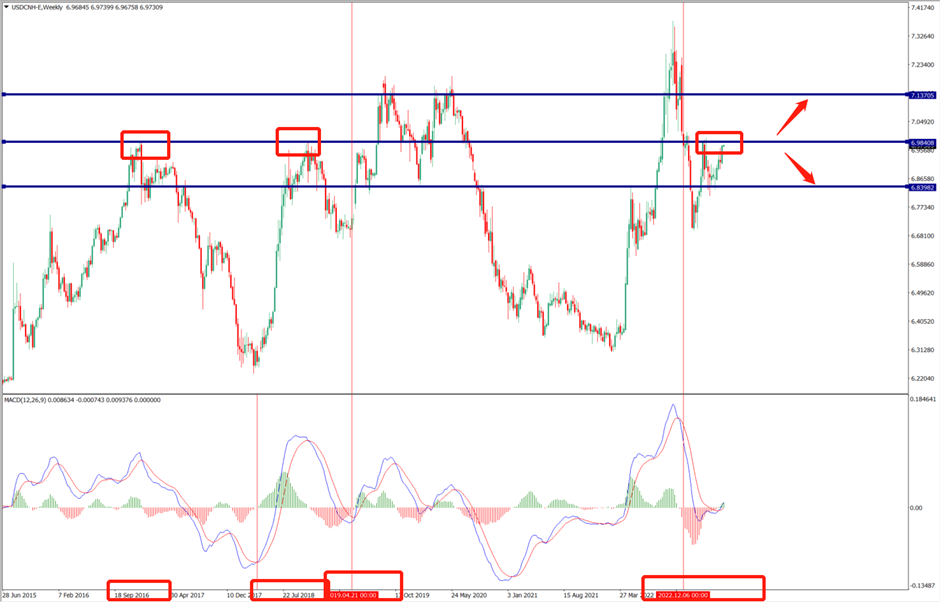
The above is the weekly chart of USDCNH. From 2015 to now, it is obvious that 7.0 is the key area. It has failed broken through 7 many times and returned to 6.8, but once it breaks through, it tends to rise all the way to the resistance position near 7.13
D1 Chart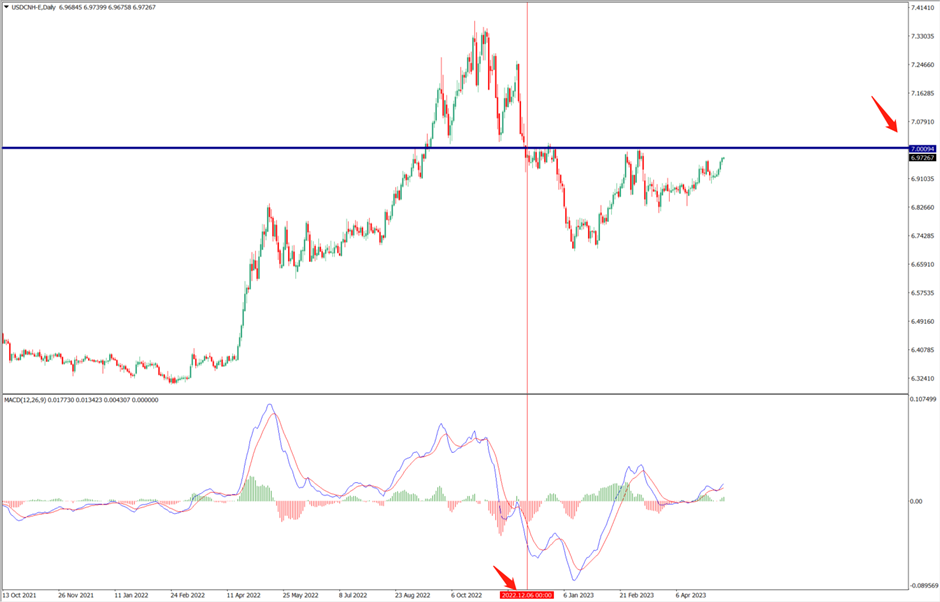
The picture above is the daily chart of USDCNH. It has closed higher for 4 consecutive days. It is likely to touch the 7.00 round number in the short term. However, since USDCNH fell below 7 mark in December 2022, there have been more than 20 attempts to break through 7 key level mark without success, which shows 7 is a strong resistance , it would take a big news for the dollar to break through the 7 mark.
What needs to be paid attention to in the future is whether the price will break through around 7.0. If the breakthrough is unsuccessful, it may fall back to the lower support around 6.83. If there is a big positive line breaking through 7.0, it may open up a space of 170 points to around 7.17.