This week will likely see August go out with a bang as we get a deluge of US economic data which could either make or break the case for another Fed hike in 2023.
On tap for traders is Preliminary Q2 US GDP data Tuesday, Core PCE Price Index Thursday, and to top if off, NFP data Friday. Let's consider the potential outcomes of each data point and spotlight a couple of potential forex trades to take advantage of the upcoming volatility.
US Preliminary Q2 GDP Wednesday 12:30pm GMT
Preliminary Gross Domestic Product (GDP) is the second in the 3-part series of releases measuring US economic output. The Preliminary GDP reading is usually released a month after the "Advance GDP" reading which is the earliest estimate of quarterly growth. The prelim has more complete data, as well as a bunch of revisions over the Advance.
This week's data is expected to confirm the US economy's solid growth rebound from the pandemic continued in the second quarter of 2023. Consensus is GDP accelerated 0.1% compared to Q1 for a 2.5% p.a. rate of increase. A healthy economy corresponds with higher interest rates, and higher interest rates are typically associated with a stronger currency. As a result, forex traders should expect a stronger than expected reading here to boost the Greenback, and vice versa.
US Core PCE Price Index Thursday 12:30pm GMT
Inflation data is always big, after all, central banks set rates based upon their respective inflation targets. As the prevailing fight against high inflation rages on, there's no data more important on the economic calendar than inflation data - and given the PCE Price Index is the Fed's preferred measure of inflation, this is going to be the one everyone's watching this week.
I'm expecting another "sticky-high" reading for the Core PCE Price Index on Thursday. Consensus is the Core PCE Price Index to tick higher by 0.1% to 4.2% p.a., i.e., a just little further away from the Fed's 2% target. If we see a number higher than 4.2% it will likely trigger a sell off in risk assets as well as another leg higher for the Greenback.
US Non-Farm Employment Change and Unemployment Rate, Friday 12:30pm GMT
If key growth and inflation data isn't enough, good news, there's another major data release on Friday. NFP data is expected to confirm the US jobs market cooling as both consumers and businesses respond to higher interest rates. Economists expect the US economy added another 187,000 jobs in July, down from the 209,000 added in June. This will make it 10 out 12 months of slowing growth in jobs, and July's reading is going to be well below the 12-month rolling average of 302,000 jobs created per month.
Despite the slowdown, the unemployment rate should stay steady at 3.5%, nothing to see there. Far more important for forex traders, however, is the update on average hourly earnings. Higher wages feeds into inflation, and higher inflation feeds into higher interest rates. Friday's data should show wages rose 0.2% on a monthly basis, adding up to a 4.4% p.a. annualized increase. This is far too high as far as the Fed is concerned, so a better/worse number will likely trigger a substantial move in markets.
Two trades to watch ahead of this week's US economic data
Any time there's a week this big in economic data, I like to plan at least a couple of trades aimed at taking advantage of a big beat or big miss compared to forecasts. Ideally, I've got one long US dollar trade setup and one short US dollar trade setup worked out in advance to implement under the right conditions. Looking across the options, I have come up with my two favorite potential trades ahead of this week's US economic data.
1. Preliminary GDP, Core PCE Price Index, NFPs are hotter than expected: Long USDJPY
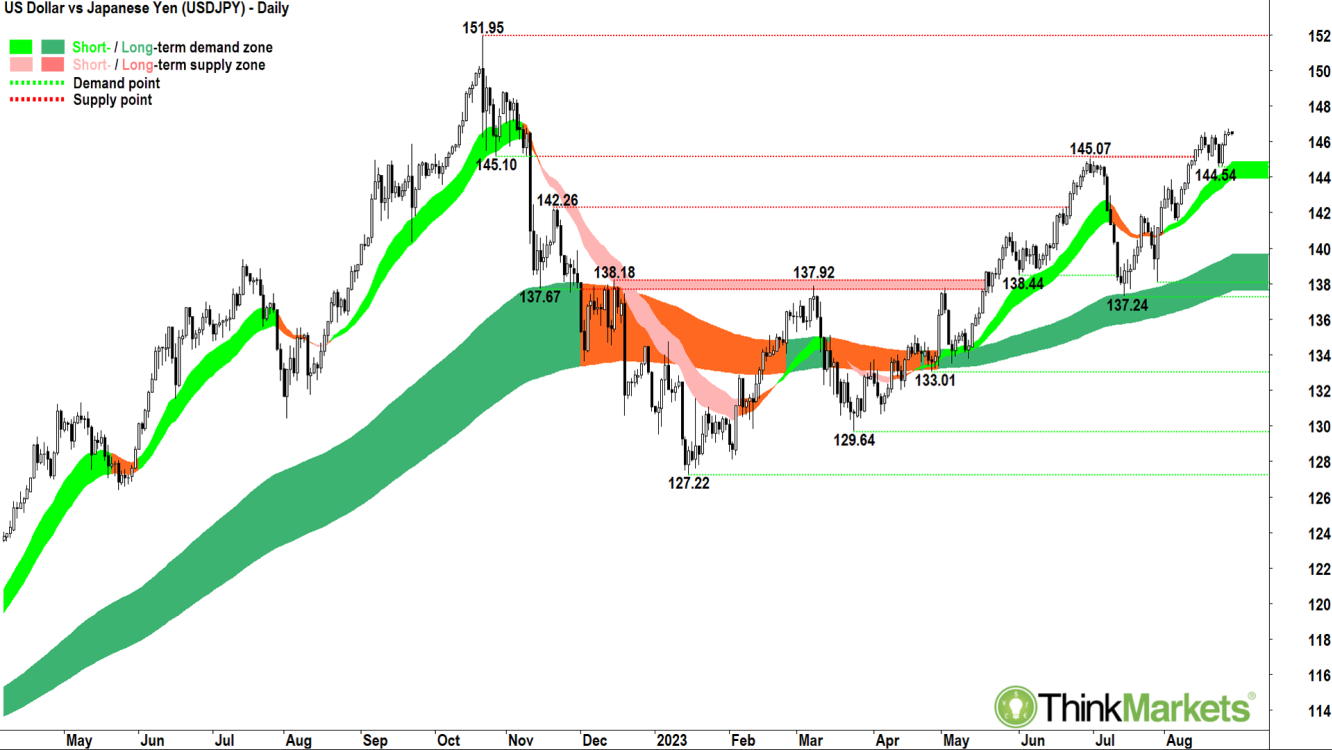
There's plenty of evidence to support the long-side thesis on Dollar-Yen should we see any or all the data this week come in hotter than expected. The USDJPY chart is in clearly defined short-and-long-term uptrends (light green and dark green trend ribbons). Add to this solid price action in term of peaks and troughs and exemplary candles (predominantly white and/or downward pointing shadows) - and there is clear evidence of excess demand for US dollars over Japanese yen.
I see support at the recent 144.54 trough. I'd also expect the old 145.07 supply level to now act as support. Stops are best set below here, naturally, but preferably also below the dynamic support at the short-term trend ribbon for safety (144-144.85).
In terms of targets, I foresee very little resistance until USDJPY reaches the 21 October 2022 major high at 151.95.
Analysts view: This week I'm looking for USDJPY longs above 144.54 on any white candle showing a high session close. Long USDJPY trades are valid while the price continues to close above the short-term trend ribbon.
2. Preliminary GDP, Core PCE Price Index, NFPs are weaker than expected: Short GBPUSD
This trade is far less clear-cut than the Dollar-Yen trade. That one's a clear continuation setup, that is, you're looking to trade a continuation in the short-and-long-term trends.
This setup is more of a counter trend trade. By their nature, countertrend trades are higher risk as you're generally fighting one or both of the short-and-long-term tends. But, if set up correctly, countertrend trades tend to also offer excellent reward to risk. This is because we're entering near a key support/resistance level and targeting a reversion back to the mean or back to the opposite side of a well-defined trading range. Stops can be set close to one's entry, i.e., just beyond the relevant support/resistance point.
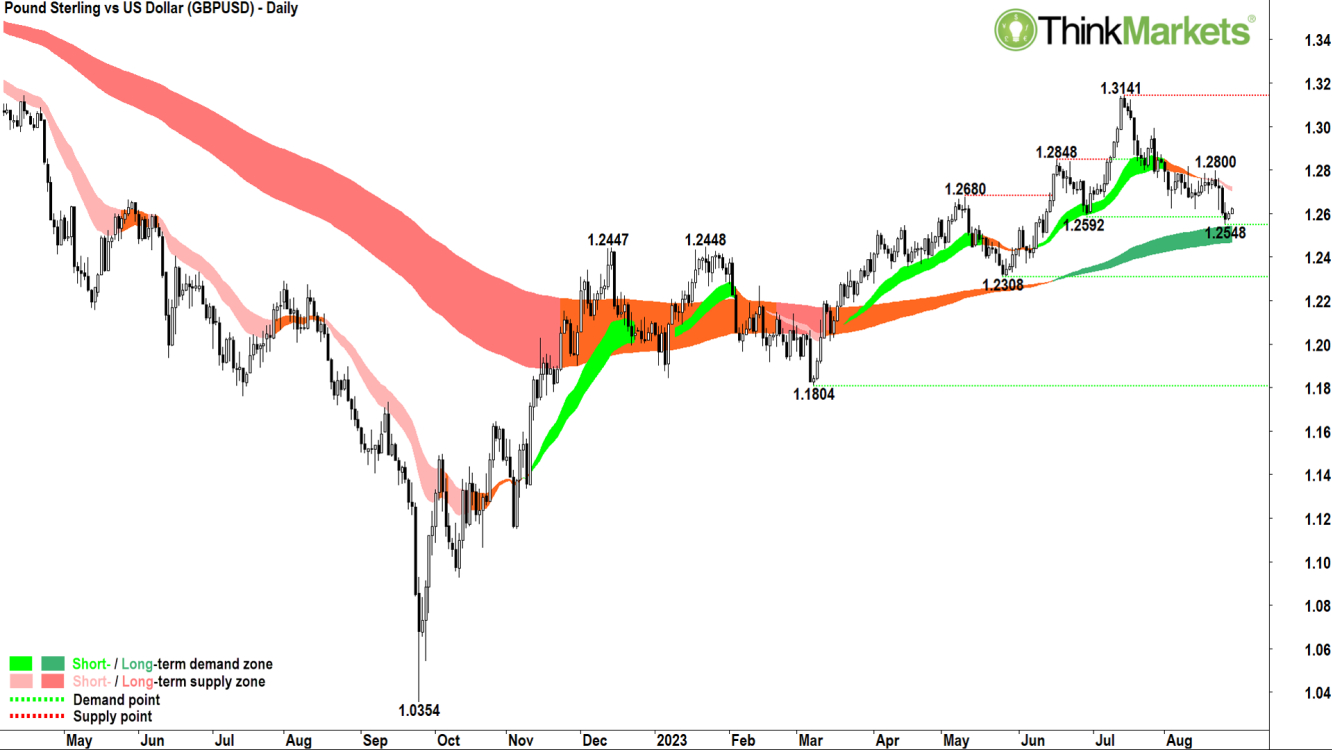
This GBPUSD trade is looking to fade the prevailing short-term downtrend (light pink ribbon) in favor of the well-established long-term uptrend (dark green ribbon). I'm looking past the lousy price action (lower peaks and lower troughs), and awful candles (predominantly black bodies and/or upward pointing shadows).
The expectation is the key point of demand at the 25 August low at 1.2548 will hold, and the GBPUSD will bounce off the long-term trend zone back up towards 1.3141. The long-term trend ribbon has a habit of offering dynamic support, and as a result, stops are best set below this zone (1.2470-1.2545). There could be some renewed selling pressure near the intermediate resistance point at 1.2800 - I'll be watching closely for supply-side candles there.
Analysts view: This week I'm looking for GBPUSD longs, but only if I observe a white candle exhibiting a high session close above the 1.2548 and the long-term trend ribbon. Long GBPUSD trades are valid while the GBPUSD price continues to close above the long-term trend ribbon.
