- The US dollar rally halted last week after Fed Minutes came out.
- This week, the greenback is eyeing key inflation and GDP data.
- It could break out toward 106 if the data is favorable.
- Invest like the big funds for under $9/month with our AI-powered ProPicks stock selection tool. Learn more here>>
The US dollar's recent uptrend stalled last week as inflation expectations eased, boosting risk appetite and causing the greenback to retreat.
Market participants are now increasingly anticipating a potential Fed rate cut later this year. The probabilies currently suggest a 50% chance of a cut in September, rising to 63% for November, and a hefty 82% for December.
This week, key events could further influence these expectations. Speeches by Fed members and Thursday's GDP data release will be closely watched by investors.
Additionally, the PCE price index, a key inflation gauge for the Fed, will be under scrutiny. Last month, the dollar weakened after the PCE data revealed a slowdown in consumer price increases.
Similarly, a continued downward trend in the index this month could put pressure on the dollar, while hawkish comments from policymakers could stabilize it.
Ultimately, the Fed remains focused on keeping inflation within its 2% target, and its actions will influence both the market's outlook and the dollar's direction.

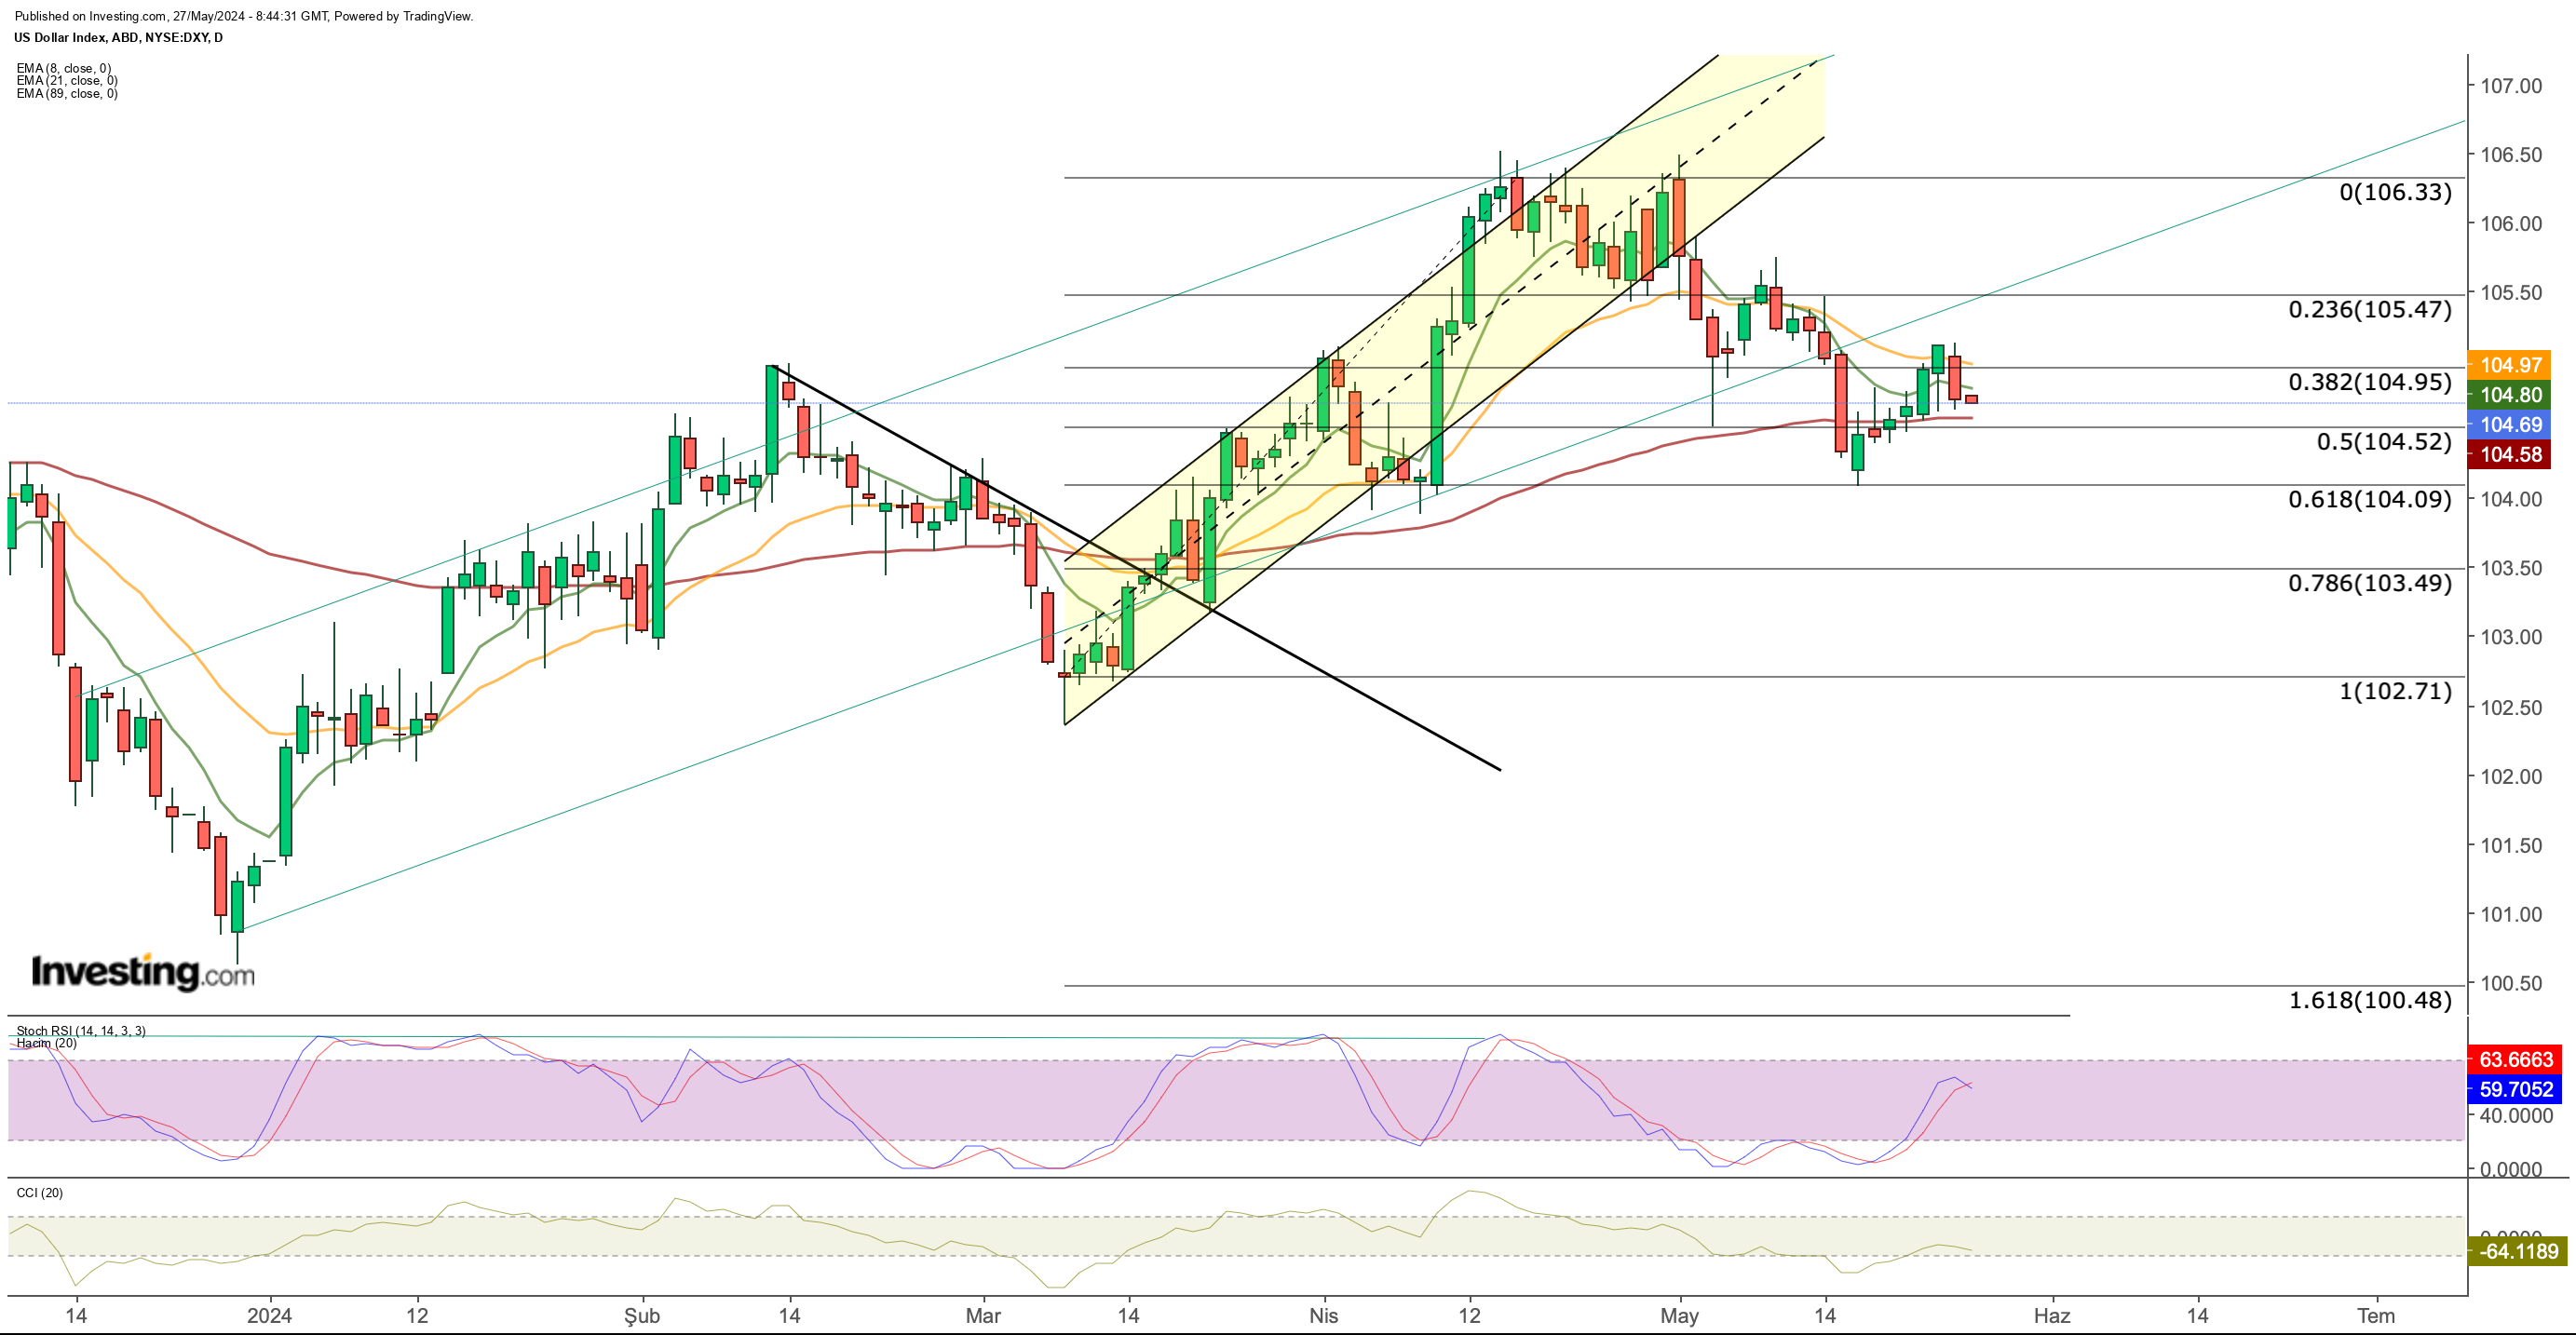
The Dollar Index (DXY) is currently caught in a tug-of-war between support and resistance. After a strong upward move, the index retreated in April and May, finding support around 104.
This correction can be seen as a natural pause after a significant climb. The DXY recovered throughout last week but weakened slightly after data was released on the last trading day.
This week's economic data releases will be crucial in determining the DXY's direction. Stronger-than-expected data on growth (GDP growth rate) and personal consumption expenditures (PCE) could push the index above 105.
A break above this level could signal a continuation of the rise, potentially reaching the 106 regions in the short term. This would likely dampen risk appetite and accelerate the outflow from risky assets and low-yielding currencies.
On the other hand, daily closes below 104.5, combined with dovish comments from policymakers or weaker-than-expected economic data, could trigger a further decline for the DXY. Overall, the index is currently in a wait-and-see mode.
Rate Cut Expectations Buoy EUR/USD
This week's inflation data from Germany and the broader Eurozone will be the final piece of the puzzle for determining whether Europe embarks on a rate-cut cycle.
Recent comments from ECB officials, including Joachim Nagel, highlight a cautious stance despite market expectations of a rate cut in June.
While acknowledging the current sentiment, Nagel emphasized the bank's focus on monitoring data and the uncertain global economic outlook.
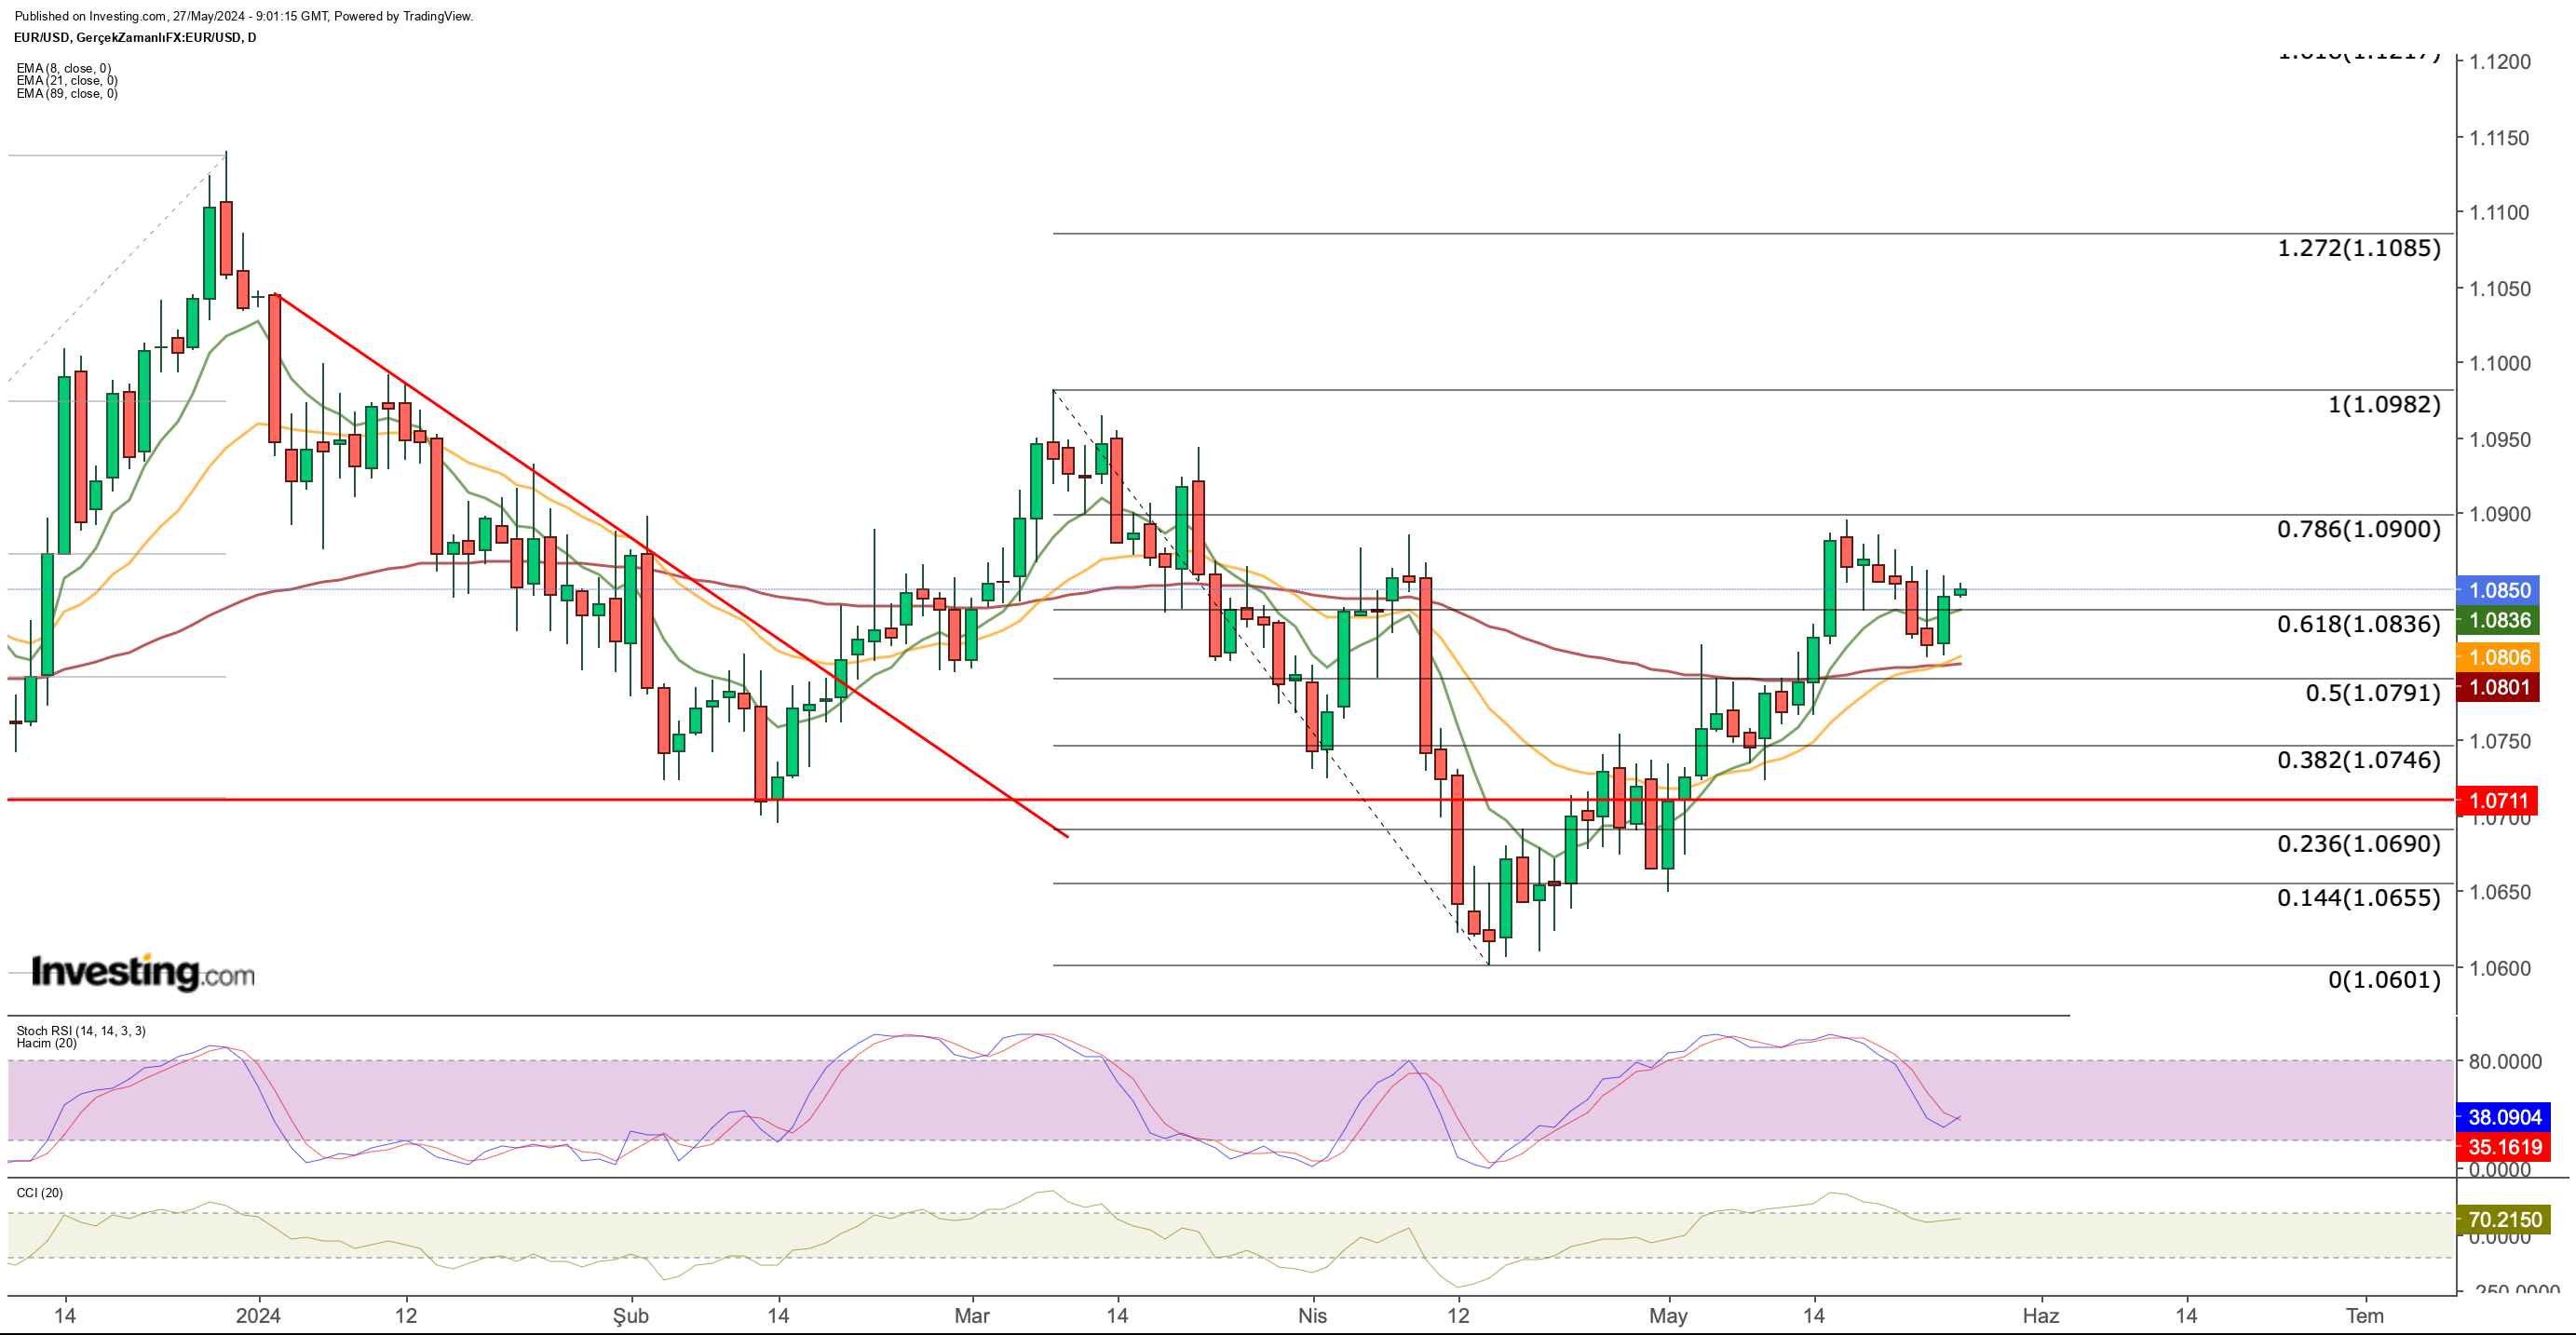
In light of these developments, the EUR/USD parity (exchange rate) is under close watch. The Euro's recovery against the dollar stalled at 1.09 last week, but Friday's weakening dollar slowed the decline to 1.08.
Technically, 1.08 acts as short-term support for the Euro. A weekly close above 1.09 would signal a potential trend continuation.

Encouragingly, short and medium-term exponential moving averages (EMA) on the EUR/USD chart are positioned bullishly above 1.09.
Additionally, the daily Stochastic RSI indicator hints at a potential turnaround without reaching oversold territory. However, overcoming the 1.09 resistance remains the key hurdle for these signals to gain traction.
Despite the potential for Euro appreciation, the significant yield difference between the Eurozone and the US remains a major obstacle.
With a rate cut in the Eurozone more likely than in the US, investors may be drawn towards US assets offering higher returns. This suggests that data releases from the US could ultimately have a more significant impact on the EUR/USD parity.
Gold: A Short-Term Hiccup or Long-Term Trend Reversal?
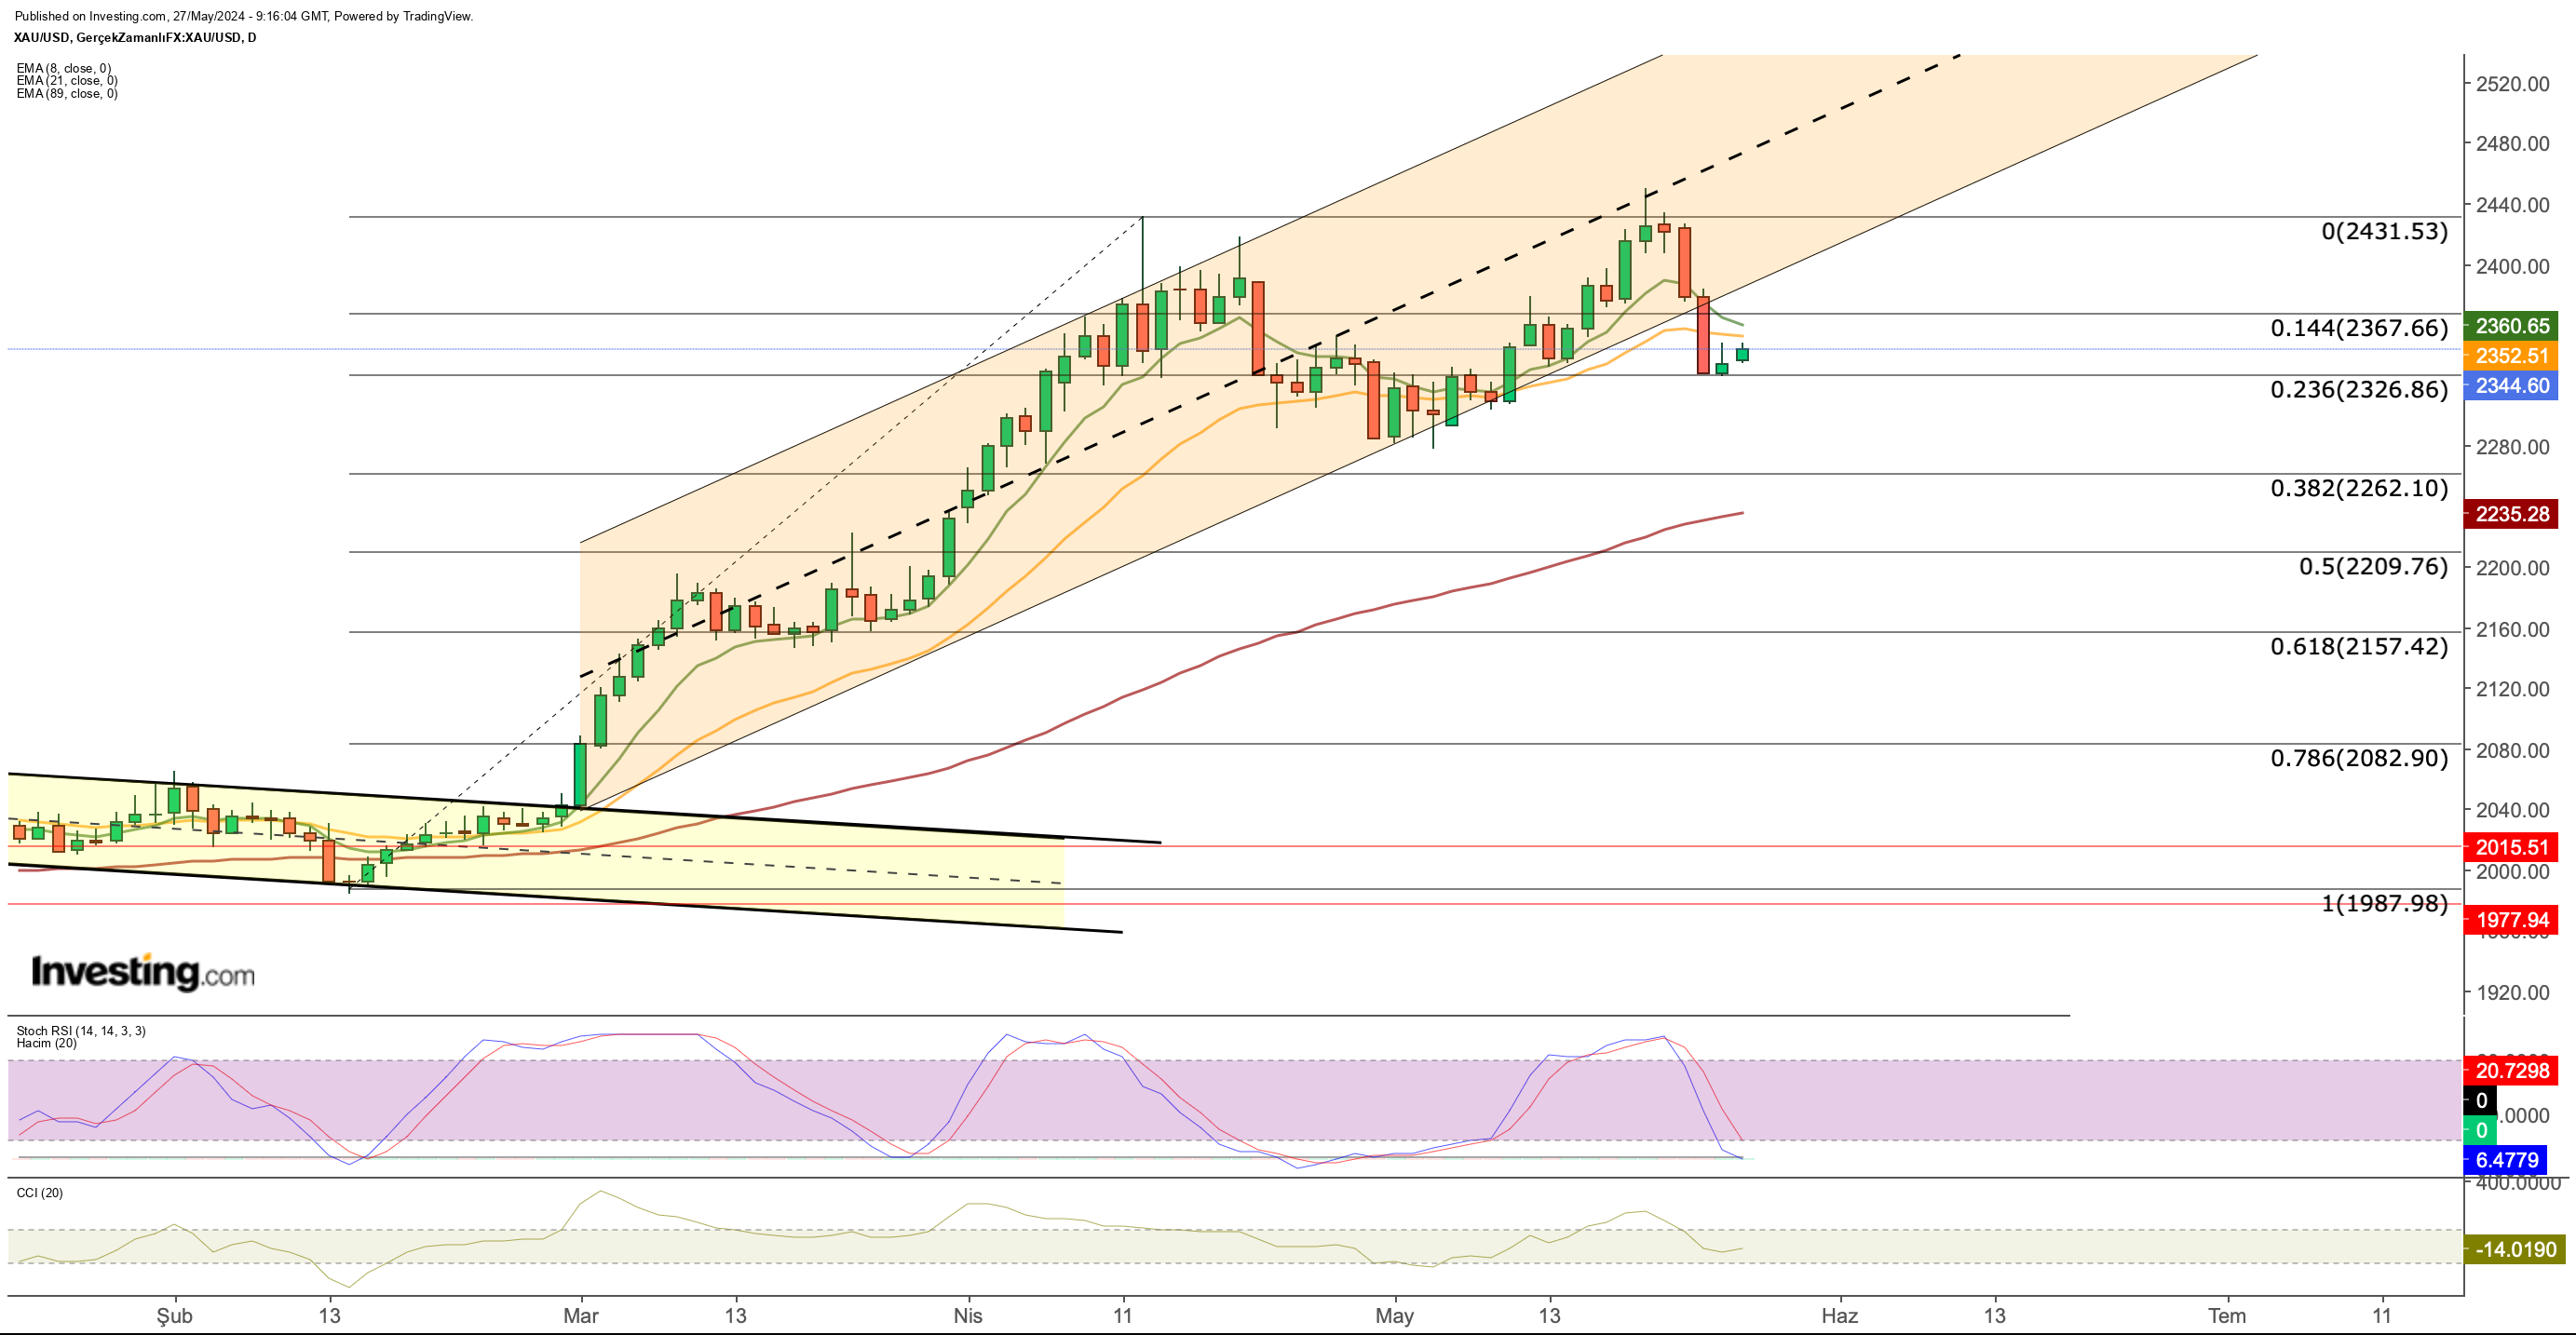
Gold prices experienced a rollercoaster ride last week, marked by significant volatility. After reaching a record high of $2,450 at the beginning of the week, gold lost nearly 5% by the close. This reversal can be attributed to a strengthening dollar and a decline in risk appetite, along with concerns about inflation raised in the FOMC minutes.
However, some analysts view this as a short-term correction. Easing inflation expectations, the possibility of the Fed cutting interest rates later this year, and continued strong demand for gold from central banks are all seen as supportive factors for the long-term outlook.

Technically, gold managed to hold above key support levels during the pullback, which is seen as a positive indicator for a potential continuation of the upward trend.
The average range of $2,350-$2,370 is the first resistance zone to watch, while the critical support zone lies between $2,300-$2,325. This week's price movements and any further economic data releases will be crucial in determining the future direction of gold.
***
Take your investing game to the next level in 2024 with ProPicks
Institutions and billionaire investors worldwide are already well ahead of the game when it comes to AI-powered investing, extensively using, customizing, and developing it to bulk up their returns and minimize losses.
Now, InvestingPro users can do just the same from the comfort of their own homes with our new flagship AI-powered stock-picking tool: ProPicks.
With our six strategies, including the flagship "Tech Titans," which outperformed the market by a lofty 1,745% over the last decade, investors have the best selection of stocks in the market at the tip of their fingers every month.
Subscribe here and never miss a bull market again!

Don't forget your free gift! Use coupon codes OAPRO1 and OAPRO2 at checkout to claim an extra 10% off on the Pro yearly and bi-yearly plans.
Disclaimer: This article is written for informational purposes only; it does not constitute a solicitation, offer, advice, or recommendation to invest as such it is not intended to incentivize the purchase of assets in any way. I would like to remind you that any type of asset, is evaluated from multiple points of view and is highly risky and therefore, any investment decision and the associated risk remains with the investor.
