December boom: Where to find the highest returns
One of the most reliable safeguards against stomach-churning market volatility is diversification. By including a wide variety of investments in one's overall portfolio as well as stock portfolio, exposure to any one risk is minimized, as different types of instruments can react differently to the same events.
But, where there is a potential return, there is also a possible loss. Deciding how much personal wealth to put into equities and how to allocate capital into different shares are key steps to managing risk and may require working with a financial planner.
Small-cap stocks can boost portfolio diversification and increase potential returns over time. For those looking to invest in US-listed small-caps iShares Russell 2000 ETF (NYSE:IWM) may be a strong candidate.
While it is not possible to directly invest in an index, the IWM ETF tracks the Russell 2000, allowing market participants to gain exposure to companies in the index. Before delving into the IWM ETF, we’ll take a closer look at the Russell indices, specifically the Russell 2000 index.
Russell Indices
A Russell index was created by FTSE Russell—a UK-based provider of a wide range of stock market indices and associated data services. However, the Russell family of stock indexes was initially created in 1984 by the Frank Russell Company to measure investment managers' performance and in 2014, the London Stock Exchange acquired Russell and created FTSE Russell.
A given Russell index tracks the performance of a broad asset class, or may focus on a narrower part of the market, like technology shares. There are several Russell index examples with a US equity focus, including the Russell 1000, Russell 2000, Russell 3000, Russell Microcap, and Russell Top 200.
According to FTSE Russell, more than $15 trillion is currently benchmarked to its indices, including approximately $9 trillion benchmarked to the Russell US Equity indices. In general, domicile rules dictate whether a company can be allocated to a single country.
The Russell US indices serve as leading benchmarks for institutional investors. And the Russell 3000 index, which represents about 98% of the investable US equity market, is one of the most notable examples of the group as it measures the performance of the 3,000 largest US companies based on total market cap.
The Russell 3000 encompasses all sub-indexes, however various investment management styles and market capitalizations categorize each subset.
The large-cap Russell 1000 index and the small-cap Russell 2000 index are regarded as two of the most important US indices. The IWM ETF tracks the small-cap Russell 2000 index and is generally used by traders and investors as the index's proxy.
While the definition of small-caps may vary slightly across US brokerages, it is generally defined as a company with a market capitalization of between $150 million and $2 billion. Small-caps have smaller balance sheets and less cash in relative terms versus their large-cap peers.
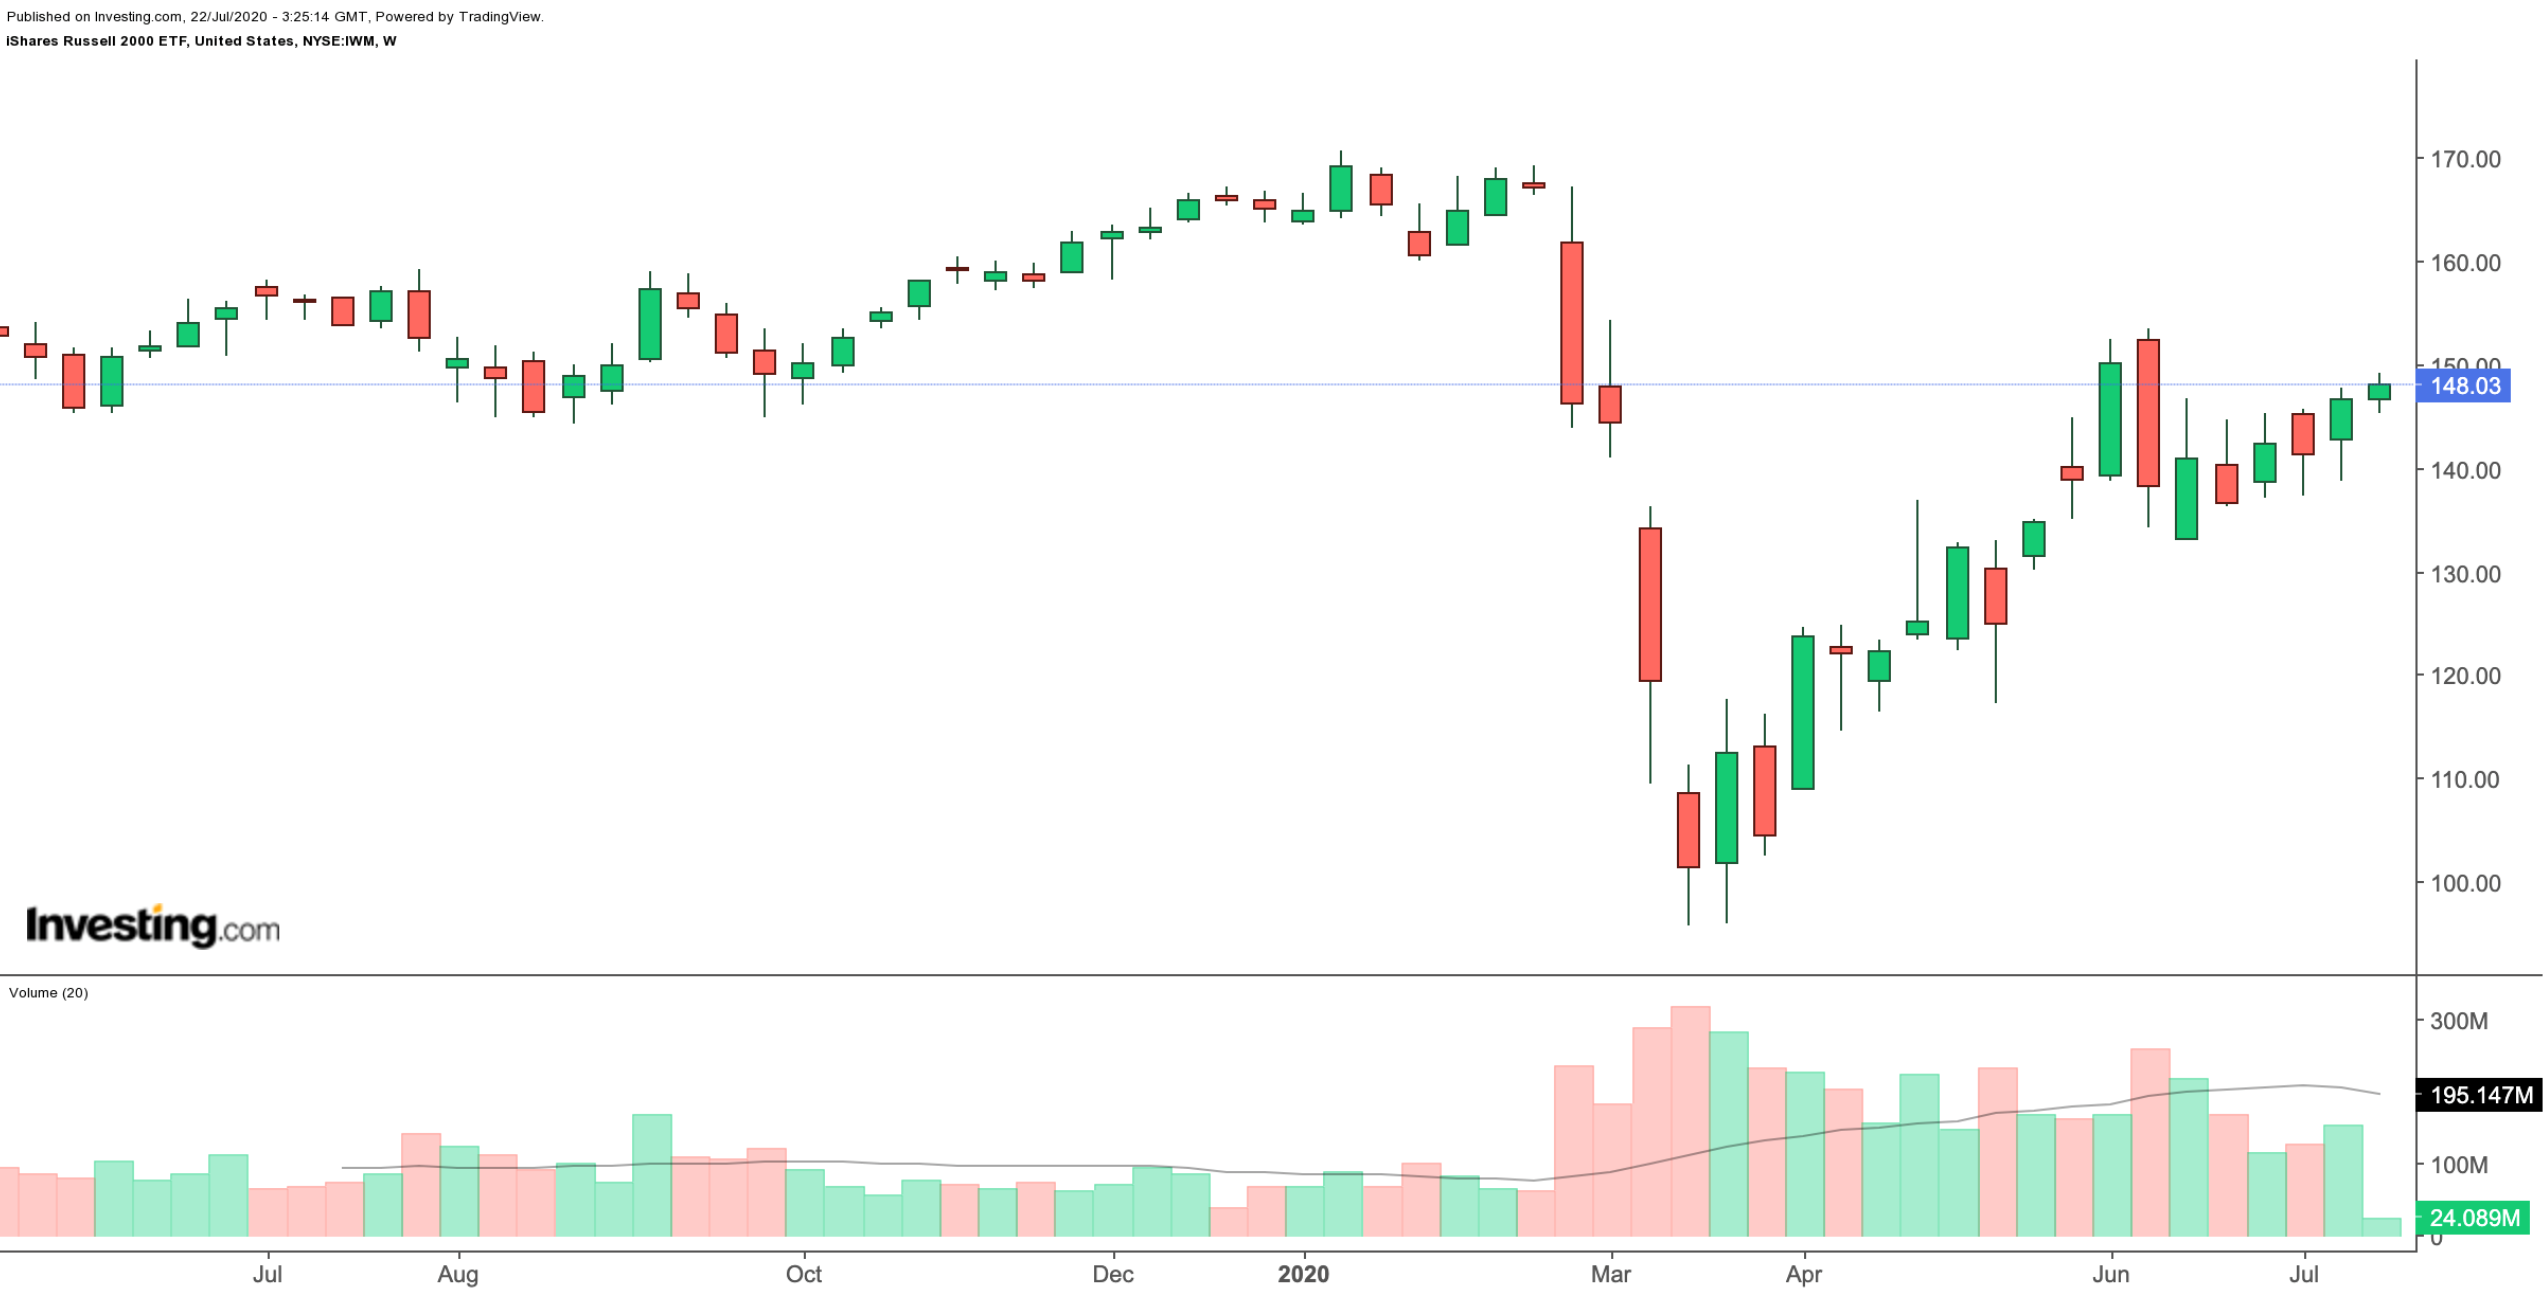
All that being said, here's a closer look at IWM:
iShares Russell 2000 ETF
- Current Price: $148.03
- 52-week range: $95.69-$170.56
- Dividend Yield: 1.37%
- Expense Ratio: 0.19% per year, or $19 on a $10,000 investment.

With its 2000 companies, the iShares Russell 2000 ETF covers all industries. Late-stage biotech Novavax (NASDAQ:NVAX), in-home healthcare provider LHC Group (NASDAQ:LHCG), footwear corporation Deckers Outdoor (NYSE:DECK), global consumer product company Helen of Troy (NASDAQ:HELE) and BJ's Wholesale Club (NYSE:BJ) are among the top holdings with big names.
Year-to-date, IWM is down about 10%. Put another way, in recent weeks, small-caps have been lagging large-caps. Over the long-run, small-cap stocks and small-cap ETFs often outperform their large-cap counterparts. However, they are typically more volatile.
The fund’s trailing P/E of 14.16 and P/B of 1.67 may appeal to value-seeking investors. Many analysts may argue that valuations frequently have limited short-term predictive power. But over the long-run, they could matter more by having a stronger impact on returns while potentially limiting downside risk. These two metrics, as well as the dividend yield of 1.37%, justifies putting IWM on an investor's watchlist.
Bottom Line
For investors interested in diversifying their portfolios, the risk/return profile of small-cap ETFs may be appropriate. In addition to the IWM, there are other small-cap stock ETFs, including:
- SPDR S&P 600 Small Cap Growth ETF (NYSE:SLYG)
- Invesco S&P SmallCap 600 Pure Growth ETF (NYSE:RZG)
- Vanguard Russell 2000 Growth ETF (NASDAQ:VTWG)
- iShares Morningstar Small-Cap Growth ETF (NYSE:JKK)
- Invesco Russell 2000 Pure Growth ETF (NYSEARCA:PXSG)
- Invesco S&P SmallCap Information Technology ETF (NASDAQ:PSCT)
We plan to cover these ETFs in the coming months.
