Global growth has been slowing rapidly according to OECD indicator
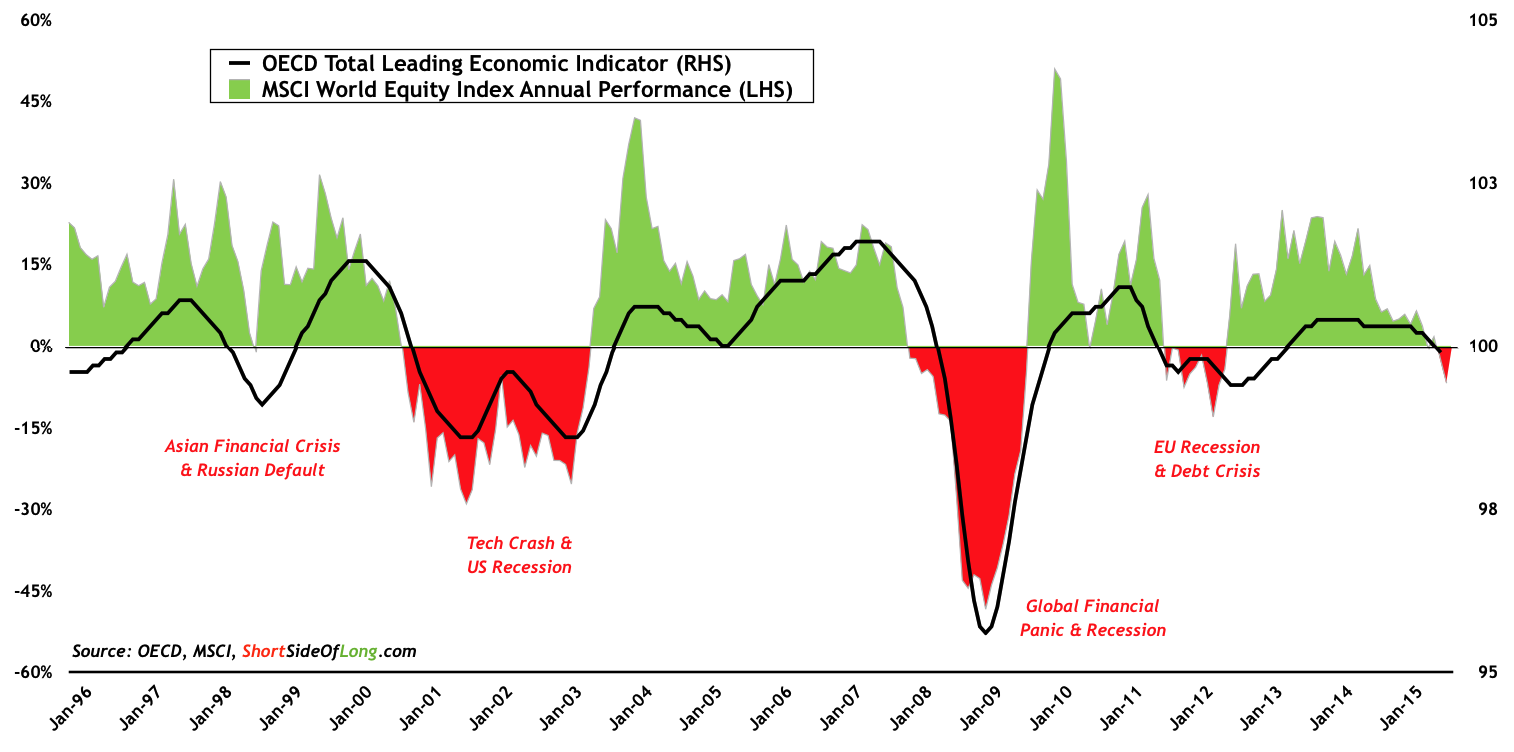
A lot of charts to get through, so let's keep it global, let's keep it simple and in basic point form. If one was to focus on the OECD’s leading economic indicator, a conclusion could be made that the world stock markets aren’t all that disconnected from growth fundamentals. The recent spike in volatility and a correction in share prices comes on the back of a growth scare and financial uncertainty regarding the future level of stimulus (will the Fed hike?). The OECD’s LEI is dipping below 100 at the same time the MSCI's World Index annualised performance has turned negative.
Chinese economic growth could be in contraction mode right now
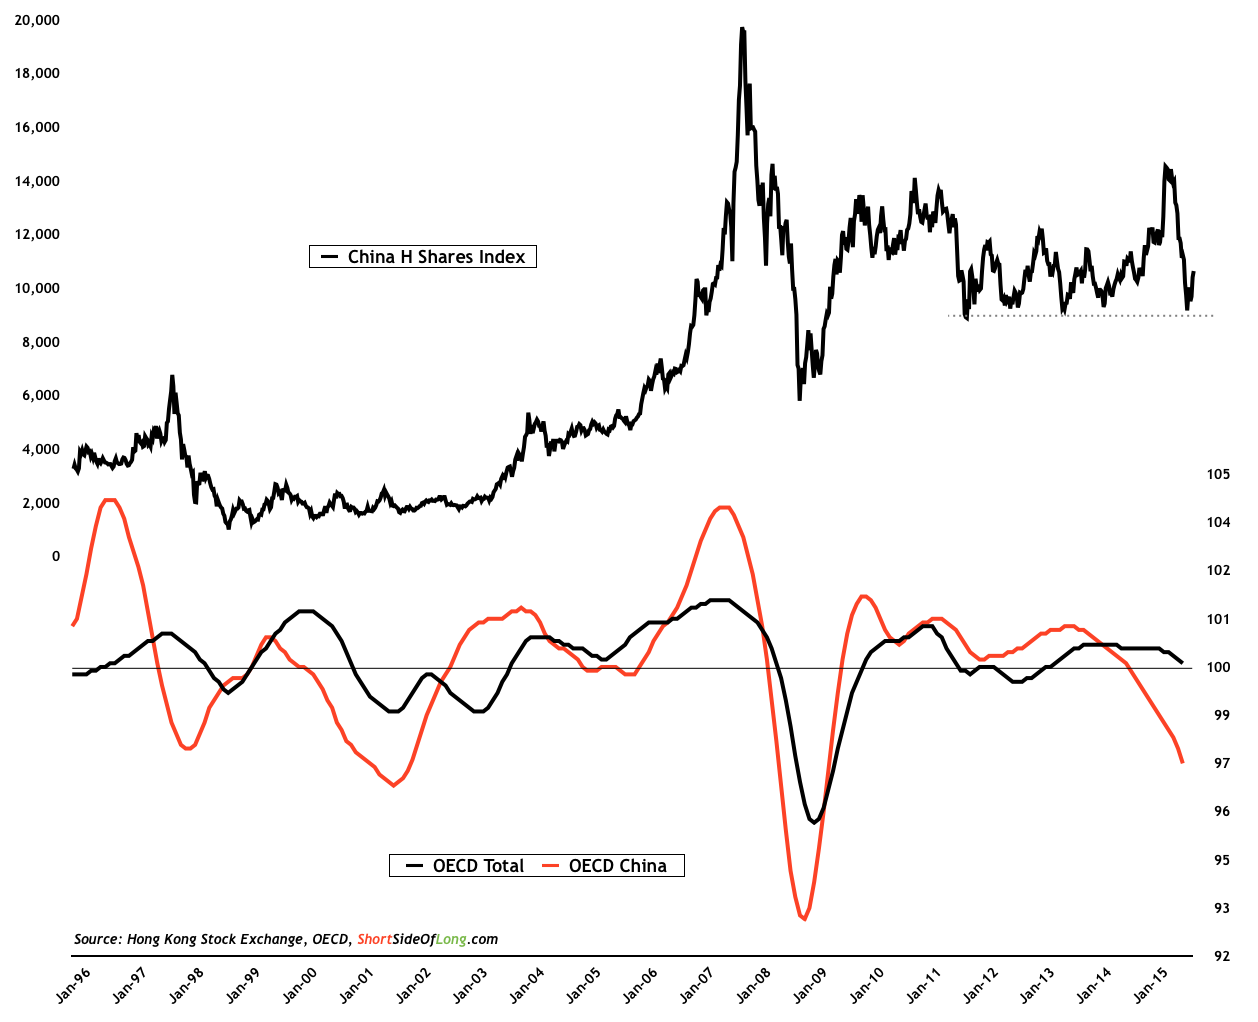
The OECD’s leading indicator for China is showing growth to be well below trend. However, our belief is not to trust economic (lagging) data too much, especially when it's reported by teh government of any country rather than by the private sector. In China’s case, we believe that growth is nowhere near the 6.9% reported Monday during Asian trade. In fact, there is a decent chance that the Chinese economy is actually not growing at all, but rather slightly contracting.
Manufacturing sector in developed economies is outperforming
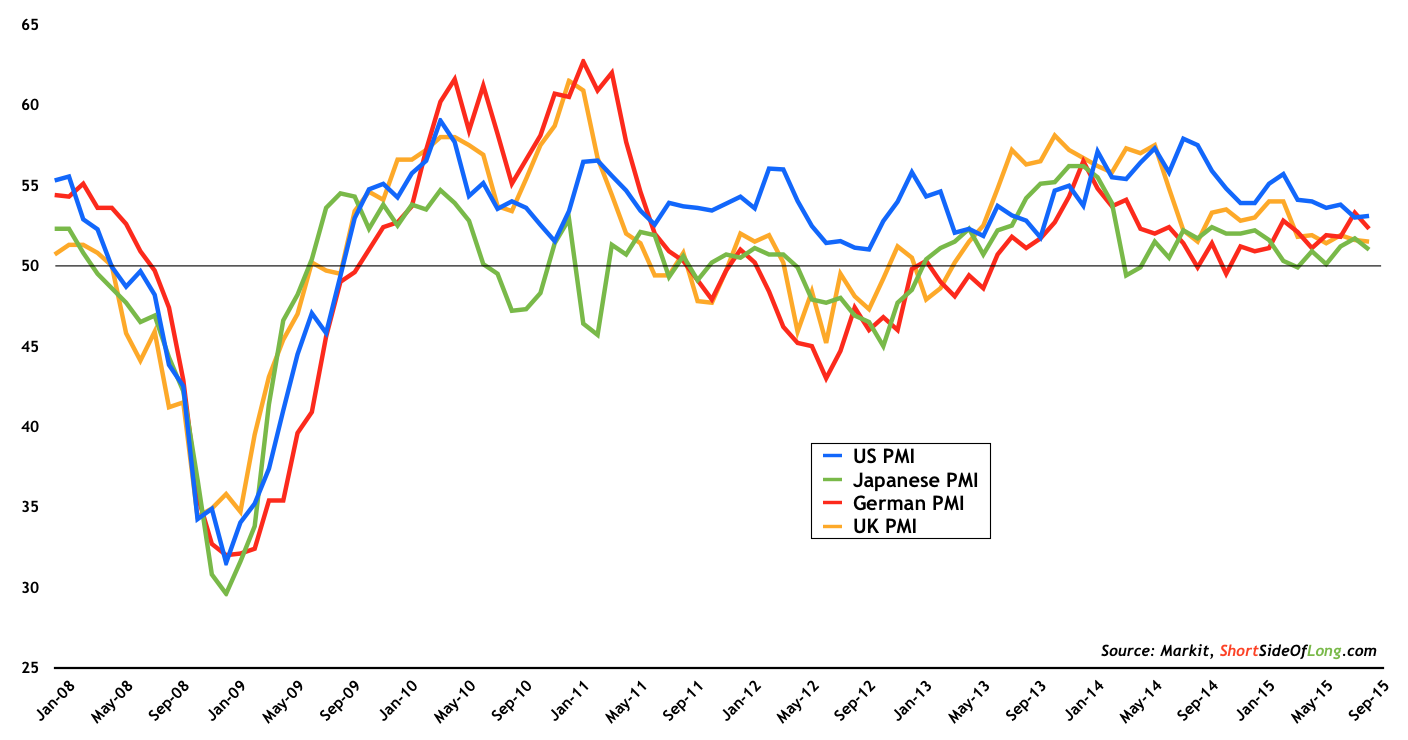
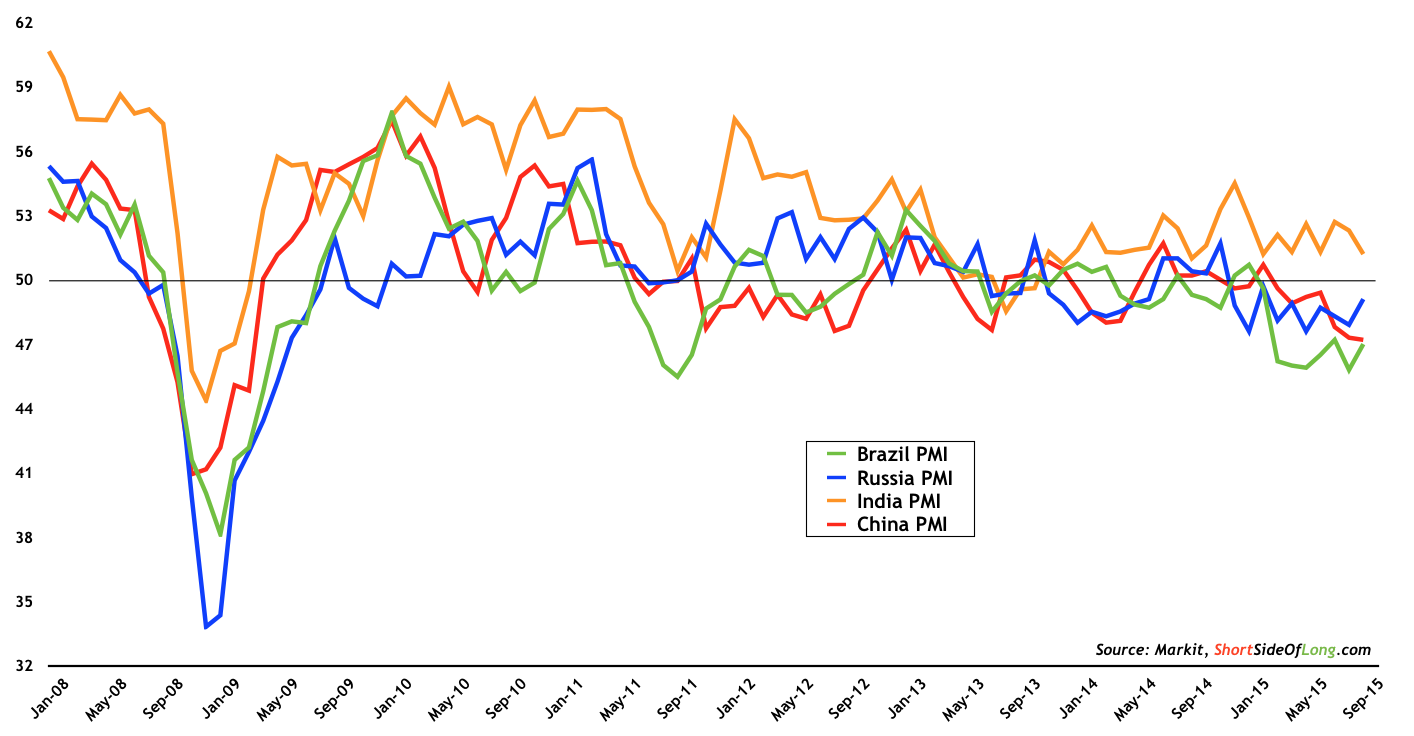
One thing is certain, despite the slowdown, developed economies continue to outperform emerging economies. For example, when we look at the recent Manufacturing PMI gauges from some of the major global economies, one can observe with ease the difference between G3 nations versus the BRICs economic block. Apart from India, the rest of emerging economies are struggling with manufacturing and export growth (next chart below).
Emerging seven (E7) economies are struggling as exports collapse
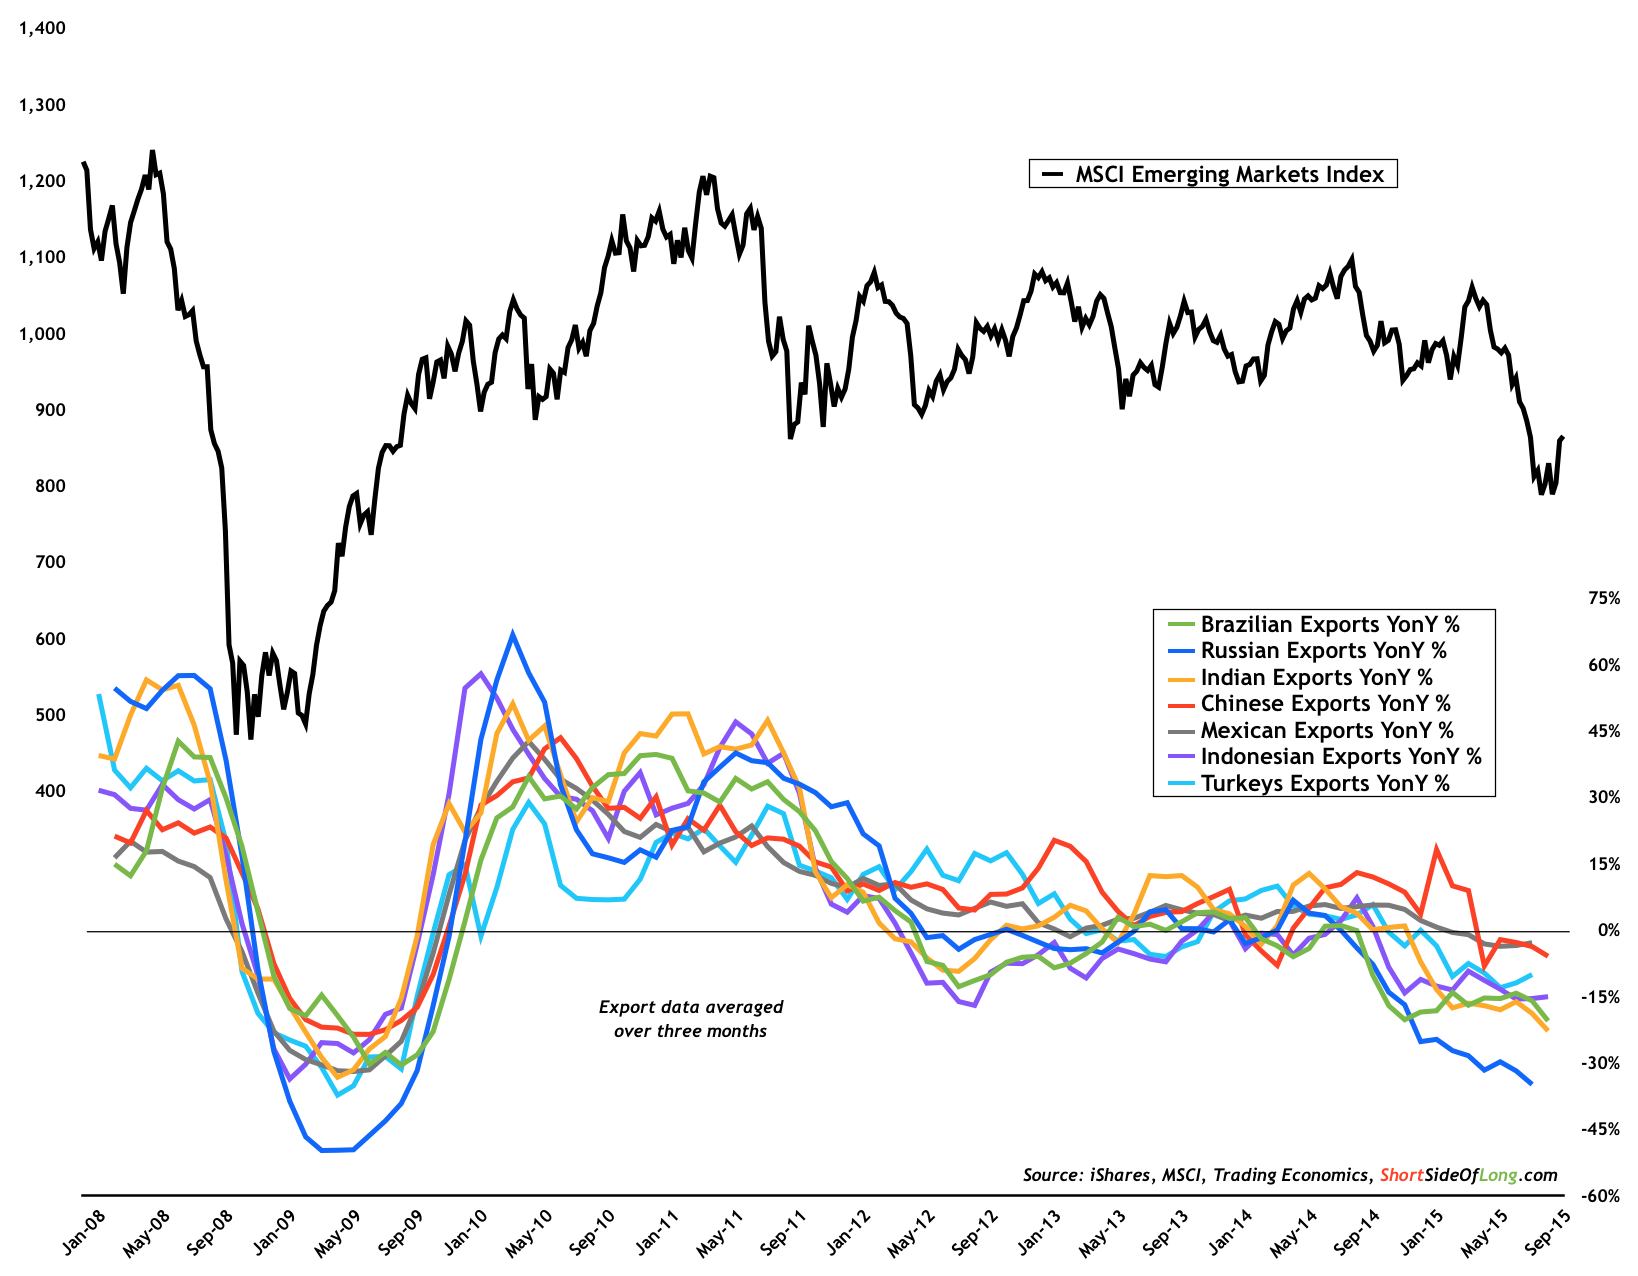
We are currently going through an export led recession in the emerging economies, for various reasons. Firstly, as already mentioned above, growth around the world is slowing and therefore global imports (demand) are weakening. With everyone from Europe to Latin America and from Africa to Asia devaluing their currencies, we have to remember that not everyone can be an exporter. Secondly, a decent portion of the EM exporters have links to raw materials, which have declined for the fifth year in the row and trade below March 2009 levels.
Mixed signals by US leading indicators with employment improving
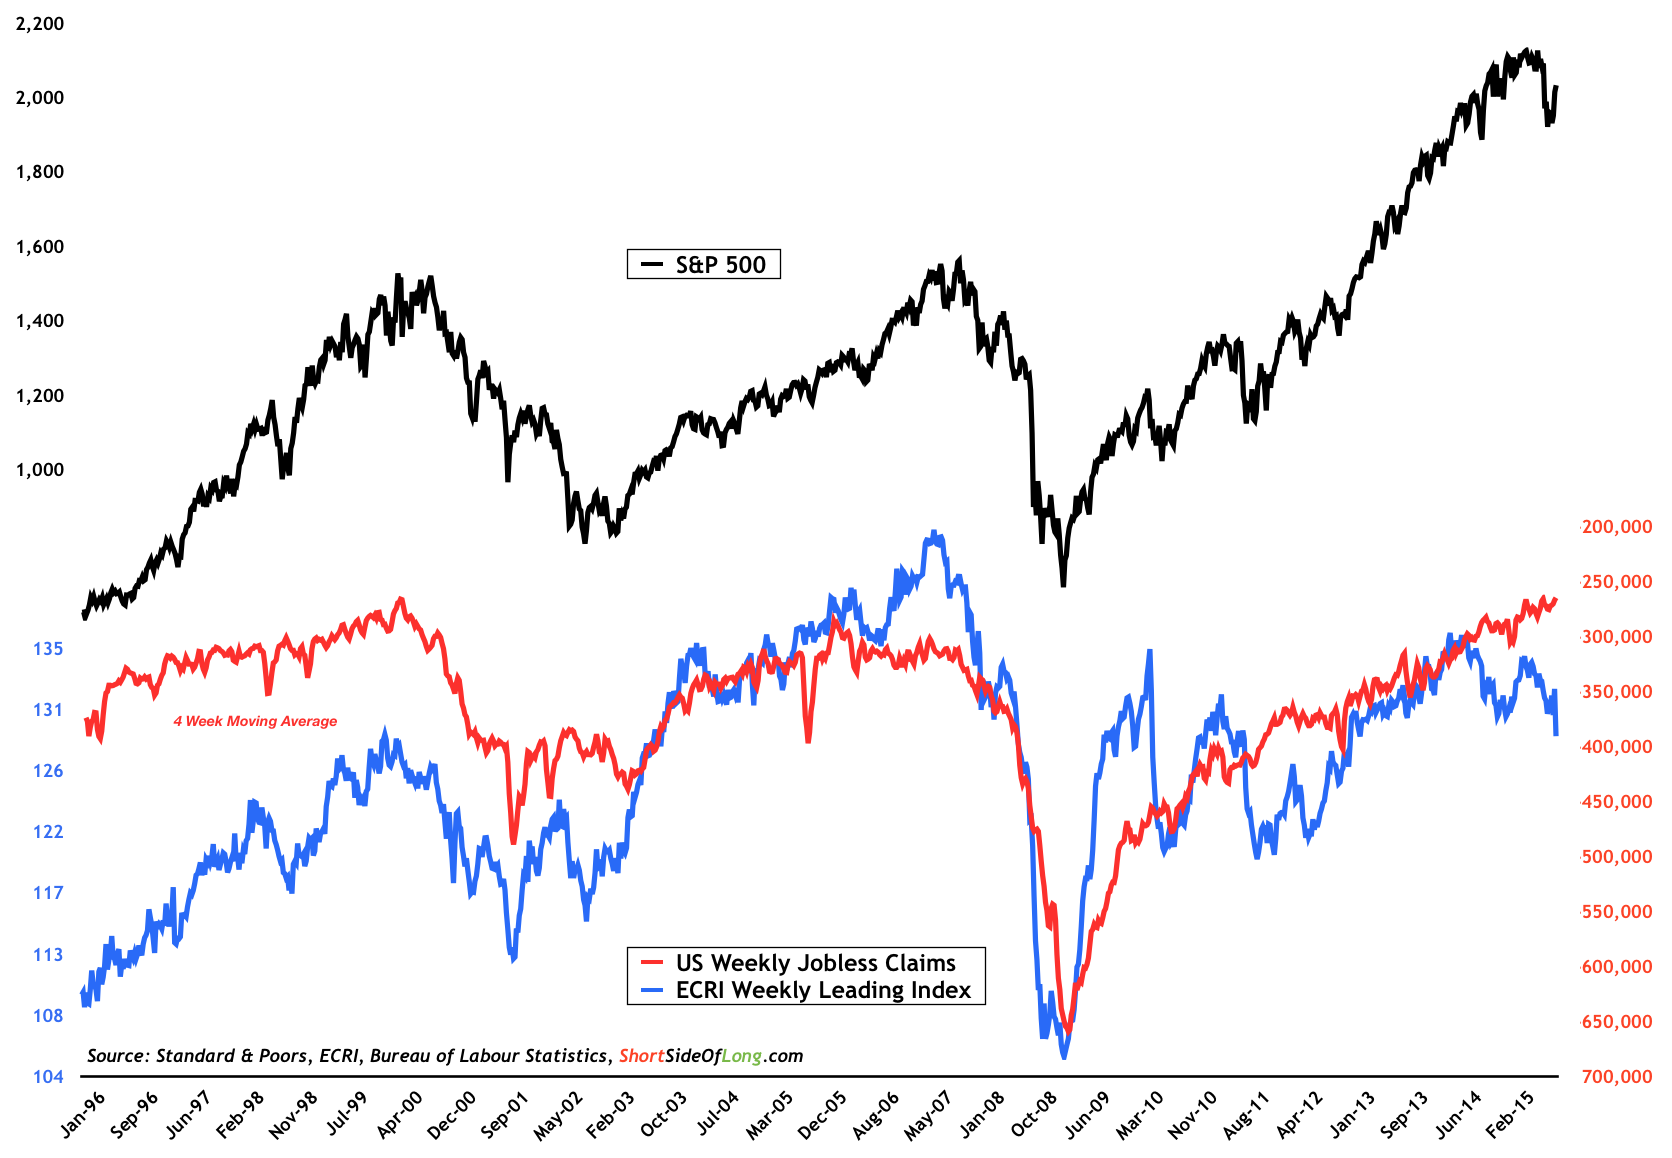
The domestic US story remains decently robust on a relative basis. However, certain leading indicators continue to give us mixed signals right now. Bears point to the ECRI’s WLI, while bulls point to the weekly jobless claims. Personally, we hold a view that ECRI’s index might be temporarily skewed towards a wrong direction as its heavily linked towards stocks and credit spreads. With both the S&P 500 and junk bonds under pressure this year, this isn’t really an indicator that’s predicting anything “new” that we don’t already know.
Japanese stocks are forecasting a reversal in business conditions
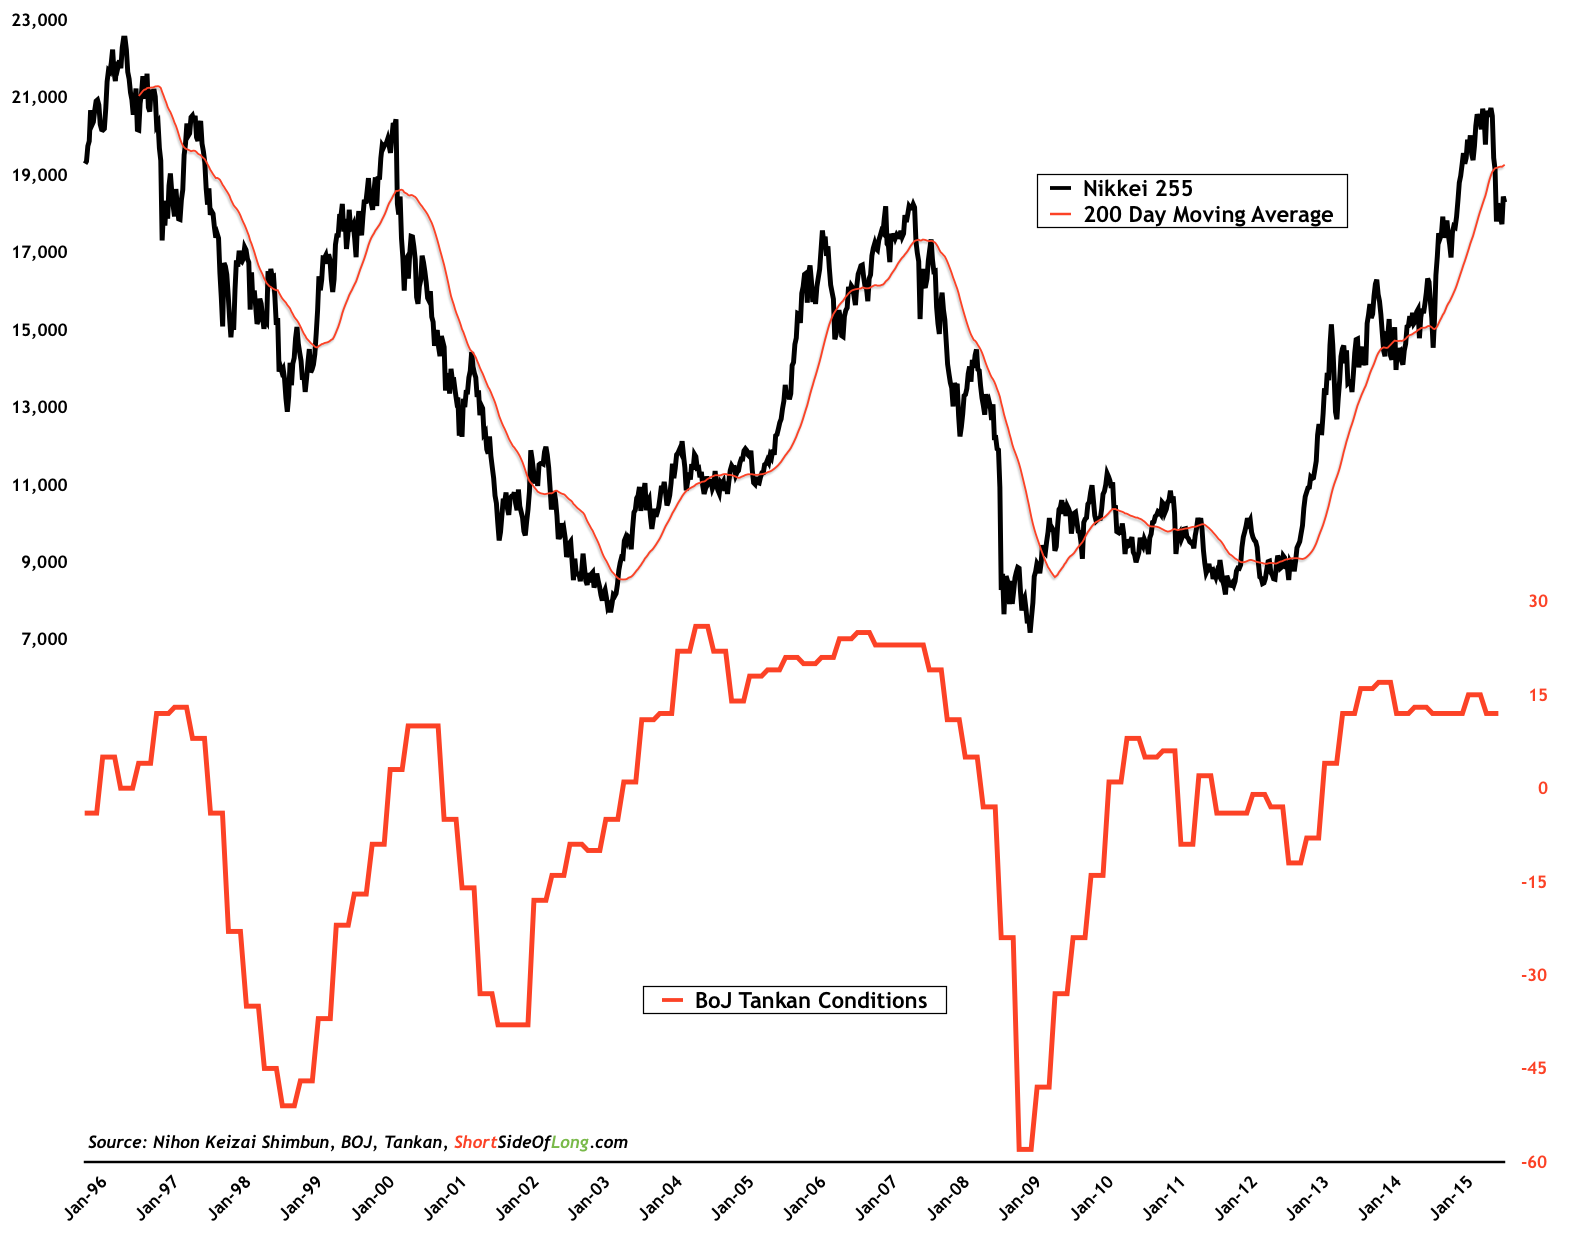
The Japanese stock market has been in a powerful uptrend ever since Shinzo Abe came into power in December of 2012. With the country's extremely loose monetary policy, Japanese equities skyrocketed on the back of a weaker yen. This has dramatically helped the private sector, with the Tankan Business Conditions remaining at a very high level of optimism. However, with the recent mini-crash in the Nikkei 225, we are anticipating business sentiment to drop. Japan just came out of a recession in the second quarter, however machinery orders and industrial production remain very weak at present. Maybe it will dip into a technical recession yet again…
Top line growth has been a disappointing factor in 2015
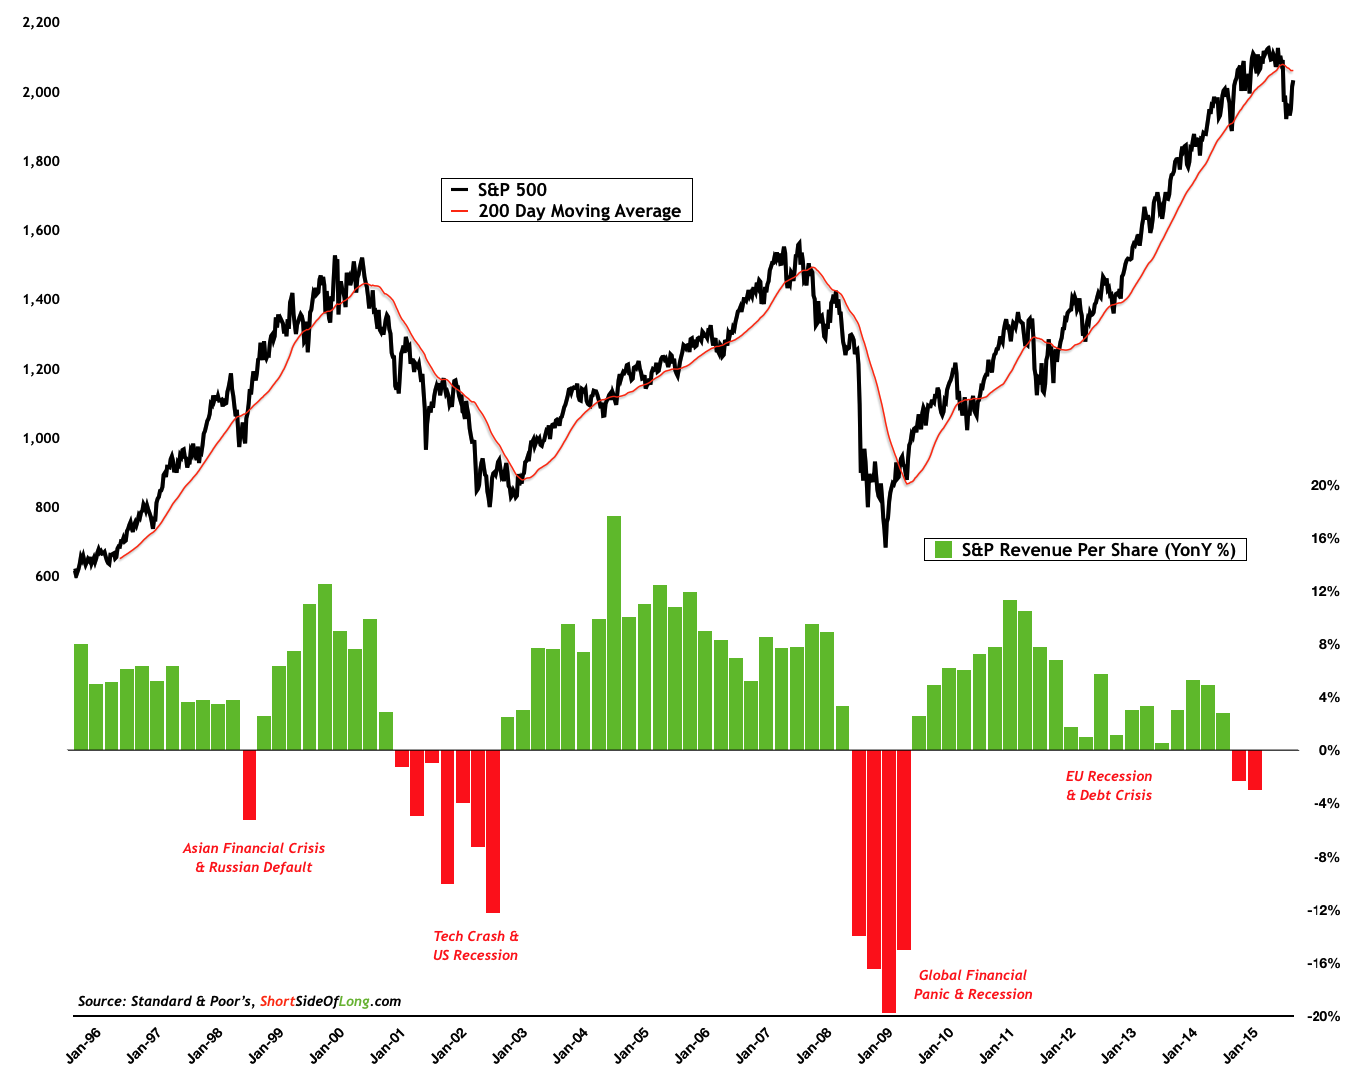
One fifth of S&P 500 companies are reporting earnings this week, in what will be an action-packed week. Analysts been making a strong case about the earnings recession. We prefer to follow top line growth (sales and revenues), as this metric is a lot harder to financially engineer by various tricks available to creative managers and accountants. The chart above shows Q1 and Q2 for 2015 have seen negative sales growth and so far, in the current reporting season, revenues continue to disappoint.
Analysts remain extremely bearish on emerging market earnings
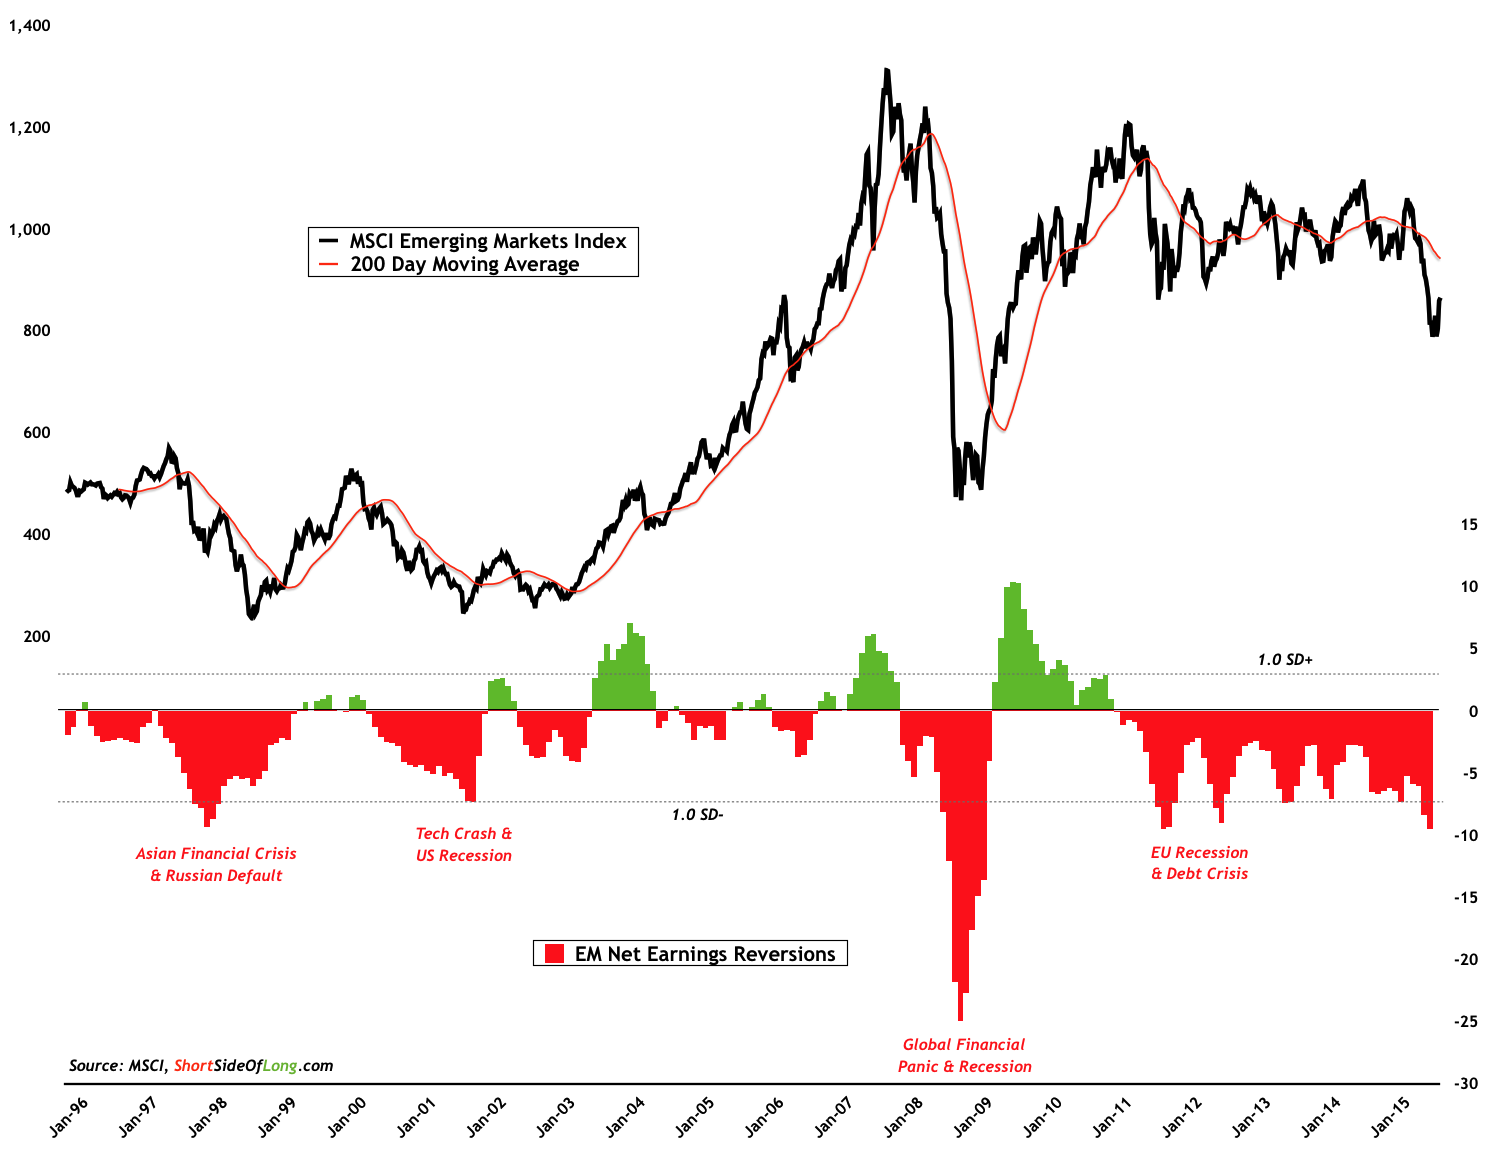
Having said that, analysts have become so bearish on emerging market earnings, that we are seeing net revisions fall to the lowest levels since the Global Financial Crisis. Current sentiment is also just as pessimistic as it was during the Asian Financial Crisis in 1997/98, the Tech Crash during the early 2000s and the Eurozone Recession of 2011/12. Looking at net earnings revisions around the world, countries where sentiment is most dampened are Australia, Brazil, Canada, China, Indonesia, South Korea, Malaysia, Russia, Singapore, Taiwan and Thailand. Clearly all strong export nations, as well as in many cases commodity producers.
