This article was written exclusively for Investing.com
As measured by the Select Sector SPDR ETF XLE, energy stocks have been the hottest group in the S&P 500 this year. The ETF is up more than 35% on the year, but that significant advance seems poised for a change in direction. Suddenly, oil appears to be weakening as higher coronavirus cases rise in different parts of the world.
The ETF has struggled to get through some challenging levels of resistance. That has resulted in options traders betting on a reversal in the sector as well. The trends suggest that the sector and oil may have peaked for the short term and is likely to see much lower prices in the weeks ahead.
Energy Stocks To Drop?
Earlier this week, there was a considerable increase in the open interest levels for the XLE June 18 $55 puts. The number of contracts increased by more than 23,000 on May 12. When digging into the data, it showed a spread trade, with a trader buying the puts. In all, they paid about $2.60 in total for the transaction. It would indicate that the XLE is trading below $52.40 by the expiration date. The more the ETF falls, the greater the trader's profit.
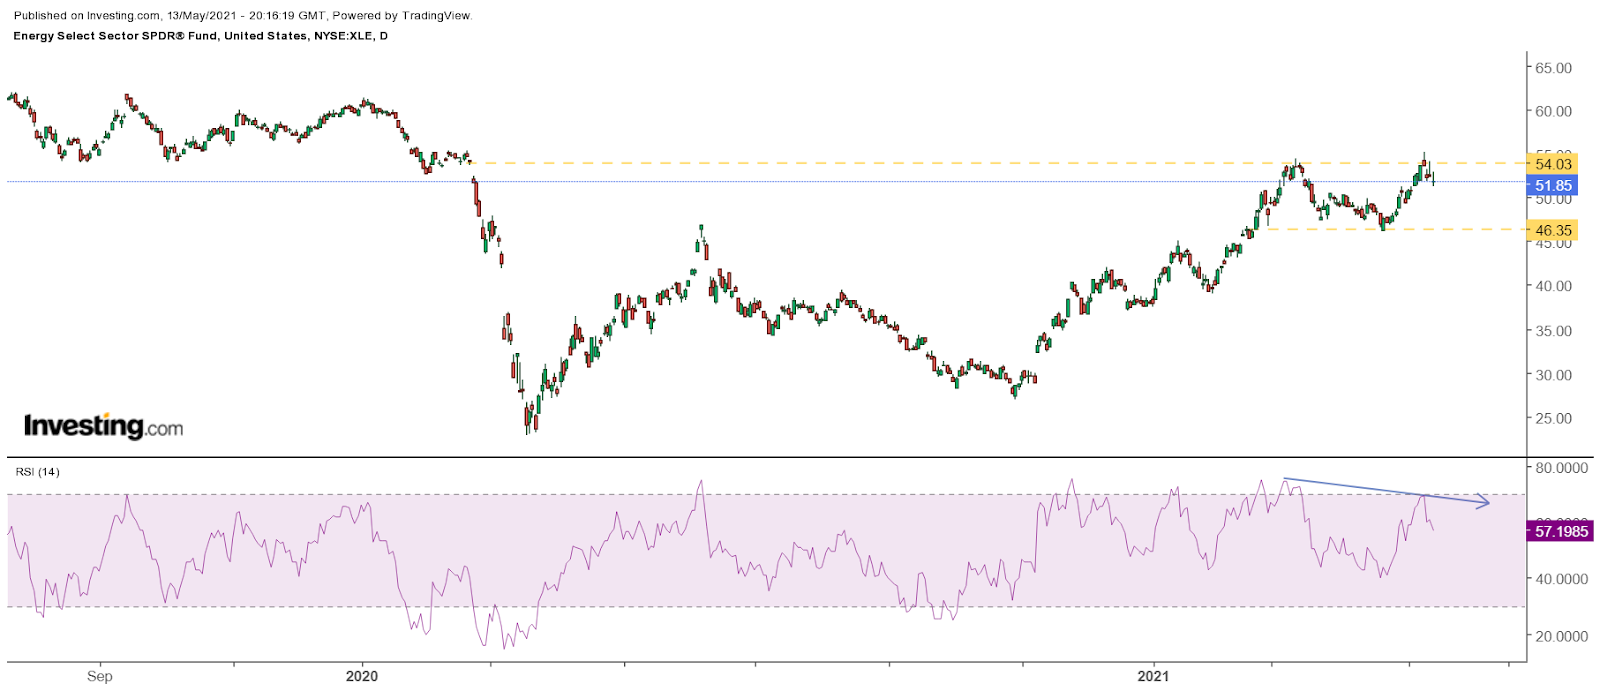
At the end of the day on May 13, the XLE was already trading below $52.40, at roughly $51.90. There are indications based on the technical chart that suggests lower prices may be coming for the XLE. Recently, the ETF has failed, for the second time, to rise above a significant level of resistance at $53.50. The first time it failed at that level was in the middle of March. Currently, the ETF is approaching support at $50. A break of that support level is likely to result in the XLE falling to around $46.35, a drop of almost 10%.

The relative strength index has been heading lower since peaking in March with a level above 70. However, the RSI has recently made a lower high, despite the ETF making a slightly higher high. This is a negative pattern known as a bearish divergence. It is signaling that the XLE has more to fall before finding a bottom.
Oil's Falling Too
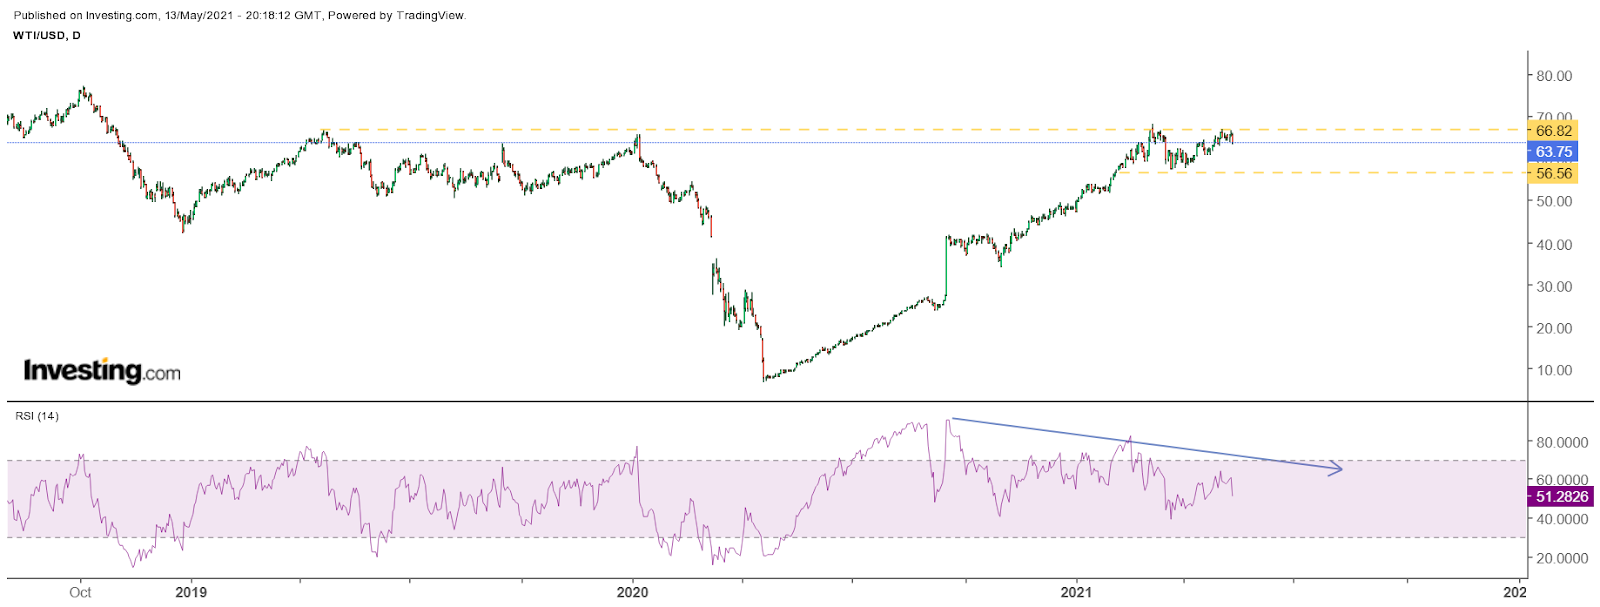
The recent weakness in the XLE stems from the current slide in oil, which shows many of the same technical trends as the XLE—oil has struggled and has been unable to rise above $67 per barrel. Despite many of the headlines of inflationary pressure taking place across the economy, oil prices have been stuck. Additionally, the RSI on oil has been showing the same bearish trends as the XLE and would indicate that a drop back to $57 is likely.

Clearly, the sector's strong performance calls for a pause or, at the very least, a modest pullback. While it seems entirely too early to think that the energy sector is likely to enter a prolonged or protracted decline, it is worth considering that there may be further for the sector to fall over the near term.
The longer-term outlook will be determined by the health of the economy and its recovery from the coronavirus pandemic. If life essentially returns to normal in the months ahead, it is likely to lead to increased needs for energy and oil products.
