Growing investor interest in exchange-traded products has led to the development of different types of exchanage-traded funds (ETFs).
On Sept. 16, the U.S. Securities and Exchange Commission underlined the significance of exchange-traded products (ETPs) in U.S. capital markets, saying in a statement:
"There are approximately 2,370 U.S. ETPs, which held in aggregate approximately $4.3 trillion in assets as of June 30, 2020. ETPs account for roughly a third of overall U.S. equity trading volume, and this percentage has increased steadily in recent years."
Not only are there ETFs specializing in different sectors, regions and themes, but in November 2019, the SEC approved "active non-transparent ETFs (ANTs)" that combine the flexibility of active management with the legal requirements and characteristics of ETFs.
Unlike traditional ETFs, which publish their holdings daily, allowing for real-time pricing, liquidity and ease trading, these active non-transparent ETFs disclose their holdings quarterly.
The disclosure frequency has been an issue of concern during the debates and studies that finally led to the new product's approval a year ago.
ETFs typically have tight bid and ask spreads and trade close to the fair value of holdings. When the holdings in a given fund are known, market participants can easily and frequently compare the ETF price with the prices of the fund's assets.
The SEC notes that ETF providers "ensure that the market price for ETF shares does not deviate too far from the value of the ETF's underlying holdings." Otherwise, large market participants could take advantage of the arbitrage opportunity, and retail investors could become disadvantaged.
On the other side of the equation, active fund managers have been concerned about the possibility of "front-running" by third party traders who speculate that a fund manager is about to shuffle holdings in an ETF. If the front runner acts before the ETF manager, investors may not get the edge or benefit of active management.
Following years of discussion between the SEC and the industry, in the case of active non-transparent ETFs, now there is agreement that fund sponsors will release a proxy portfolio that provides "enough information to keep the fund's price in line with asset values." But the information does not destroy the value of a manager's investment strategy.
Although ANTs are now fully legal and operational, the SEC would like investors to realize that in times of limited liquidity, retail investors may "face wider spreads and hence get prices that do not accurately reflect the value of their shares."
Over the past 11 months, more than a dozen active non-transparent ETFs have started trading on U.S. exchanges, and the number is expected to grow significantly within the decade. Today, we take a closer look at one of these funds.
American Century Focused Dynamic Growth ETF
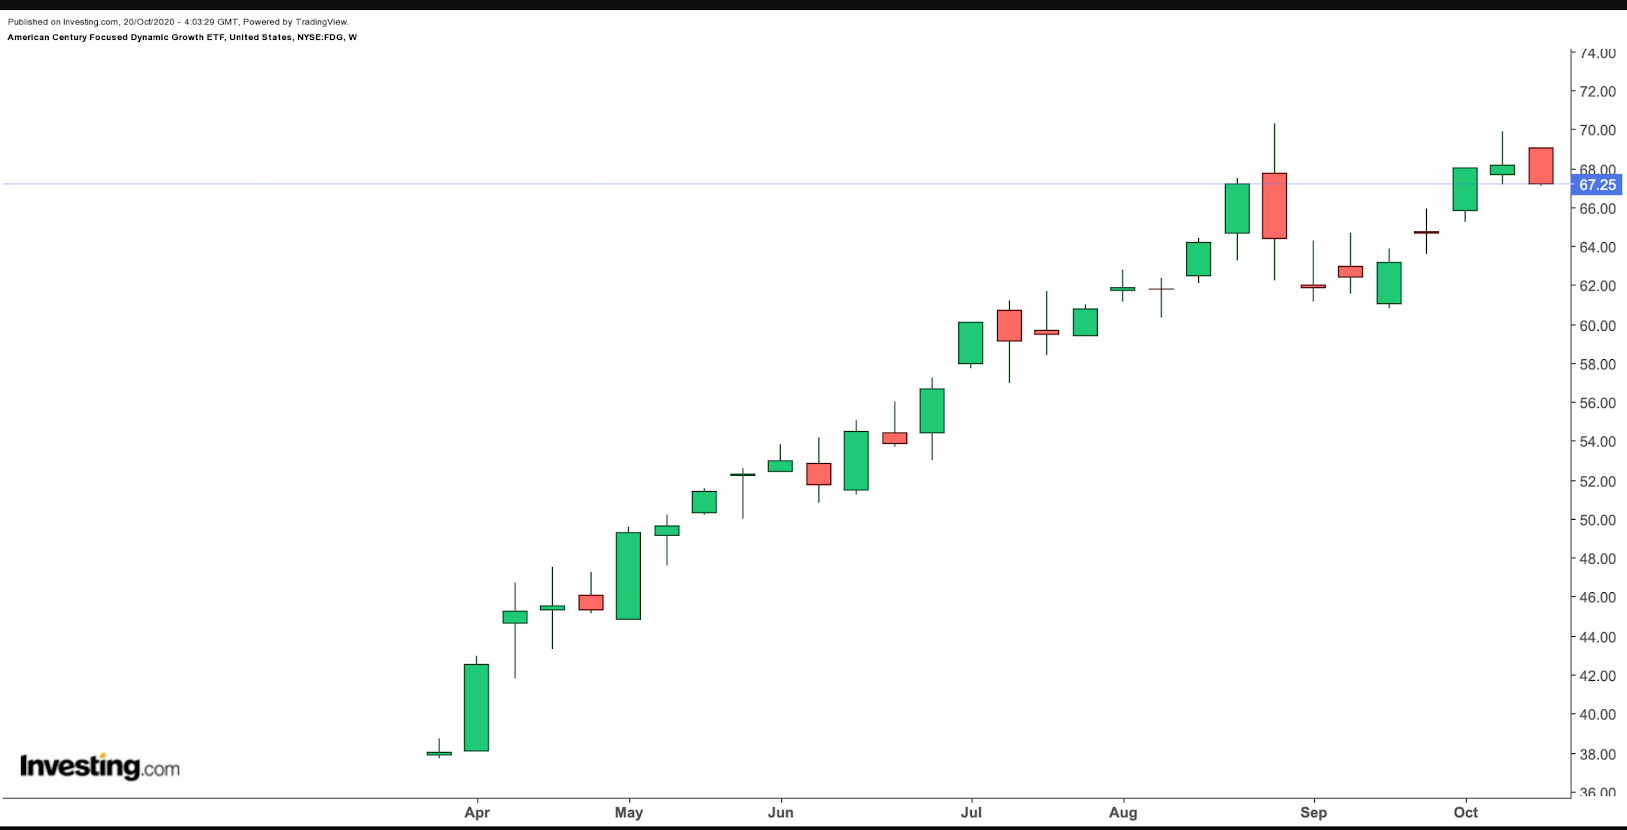
- Current price: $67.25
- 52-week range: $37.71 – $70.28
- Expense ratio: 0.45%
The American Century Focused Dynamic Growth ETF (NYSE:FDG) provides exposure to large-cap growth companies with long-term capital appreciation potential. The fund tracks the Russell 1000 Growth Index.

As of Sept. 30, FDX has 37 holdings. A total of 98% of the companies are U.S.-based, while the rest come from Belgium. The top 10 firms make up more than 50% of net assets, which stand at $207.7 million. Amazon.com (NASDAQ:AMZN), Tesla (NASDAQ:TSLA), Salesforce.com (NYSE:CRM), Square (NYSE:SQ) and Visa (NYSE:V) lead the list of companies in the ETF.
In terms of sector allocation, information technology (36.31%) has the highest weighting, followed by consumer discretionaries (27.73%) and health care (11.68%). The fund’s trailing P/E and P/B ratios stand at 56.69 and 9.55.
The fund started trading on Apr. 2, at an opening price of $37.91. The next day, it saw an all-time low of $37.71. Since then, FDX is up about 80%, hitting an all-time high on Sept. 2.
By comparison, since the lows hit in early spring, the S&P 500 index and the NASDAQ Composite are up about 60% and 76%, respectively. Prospective investors should keep the fund on their radar to analyze FDX’s returns to make a better-informed decision on whether to invest.
Bottom Line
Active non-transparent ETFs are newcomers to the vast world of exchange-trade products. A number of traditional mutual funds is expected to enter the ANT space as they could easily use their existing infrastructures without incurring too many extra costs.
ANTs are likely to become alternatives to actively-managed mutual funds in the quarters ahead as they offer intraday ease of trading, which traditional active mutual funds lack. We plan to return to this topic in the months ahead.
