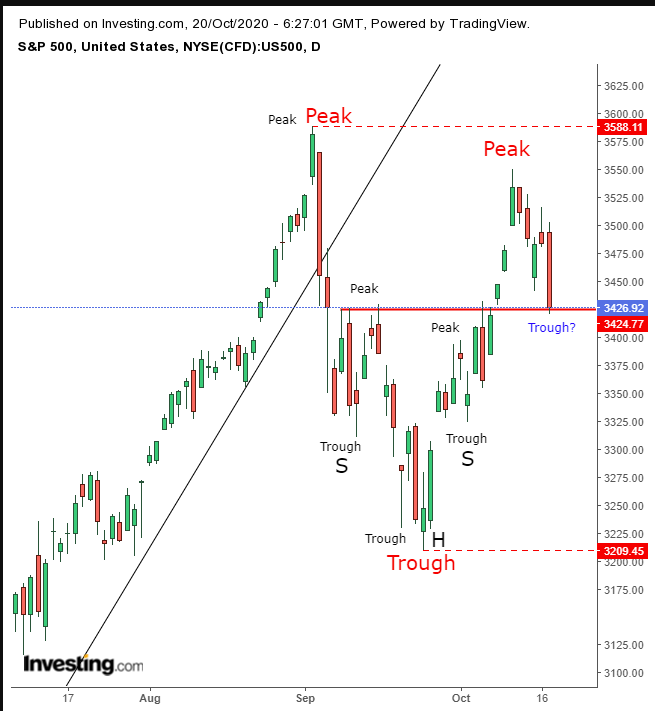
The S&P 500 Index fell over 1.6% yesterday, closing at a two-week low amid another swing in the seesawing stimulus talks. Stocks, that opened moderately higher on hopes that a stimulus deal might be reached prior to the Nov. 3 elections, dramatically reversed course on the ever-elusive agreement.
Now, the trick is to figure out whether yesterday’s drop—the worst since Sep. 23—was so forcefully bearish that all of the supply was spent, bottoming the price, or merely a corrective profit-taking move before the price rallies again.
We’ll pause here and clarify that we don’t have an answer to that question, as we don’t own a crystal ball. However, we can and will discuss the forces at work, their consequences and how to navigate the various possible outcomes.
As always, first, let’s look at the chart.

As we can plainly see, on Sept. 4 the benchmark fell below its uptrend line since the March low and bottomed out on Sept. 24, though at the time it wasn’t clear that the price had bottomed out. For all traders knew, it could have been part of a move lower, just like the Sept. 11 low. However, after completing a small, month-long H&S bottom, a pattern which records a trend reversal has manifested from the direction of peaks and troughs.
The two rising peaks and troughs registered since the Sept. 24 bottom established a short-term uptrend. That means that—in the short term—advances are considered as part of the trend, while declines are presumed to be take-profit corrections inviting dip-buyers to add another leg to the rally.
Ergo, yesterday’s selloff is presumed to be a setup for another rally, for as long as the short-term holds. A fundamental driver could be a breakthrough on fiscal aid talks, progress on a potential COVID-19 vaccine or a presidential tweet.
It doesn’t really matter which event boosts stocks. The point is that according to the principles of technical analysis, stocks are primed for another rally. Traders are just looking for an excuse. Case in point, note how the selloff was stopped dead in its tracks on the very cusp of the H&S neckline, where the reversal pattern highs meet.
Trading Strategies
Conservative traders would wait for a new high above the September record peak to return the short-term trend above its uptrend line (or establish a new uptrend line), as stocks record another peak, extending the medium-term uptrend.
Moderate traders would risk a long position upon confirmation of support above the neckline, with at least one long, green candle.
Aggressive traders are likely to consider an entry at this level a reasonable risk, at least from a risk-reward perspective, given that the price sits right on top of its support. However, there is risk buying into a selloff and proper money management is the difference between successful trading and failure—irrespective of the analysis. Here is an example:
Trade Sample
- Entry: 3,425
- Stop-loss: 3,400
- Risk: 25 points
- Target: 3,550 – Oct. 12 high
- Reward: 125 points
- Risk-Reward Ratio: 1:5
Author's Note: This is just a trade sample, a term that suggests there are other approaches to trade this asset. There is not one correct way to trade it. There are different strategies that could work, for as long as you are consistent, allowing yourself the odds of recouping losses and the space for profits. Your personal circumstances affect the trade. Consider your timing, budget and temperament.
