- Powell's latest speech was music to the ears of stock investors worldwide
- As a consequence, the Dow Jones hit a new closing high, showcasing the breadth of the current bullish trend
- S&P 500's historical outperformance in low inflation years, US dollar weakening indicates markets could be in for another bullish year in 2024
Thanks to the most aggressive rate hike cycle in recent years, the central bank has managed to contain inflation without causing a recession - so far.
Now, in a surprising turn of events, Fed officials have made clear their intentions of implementing a series of cuts in 2024, totaling 75 basis points (more easing than indicated in September).
This comes after Powell, a few weeks ago, declared it was premature to talk about the timing of rate cuts back then.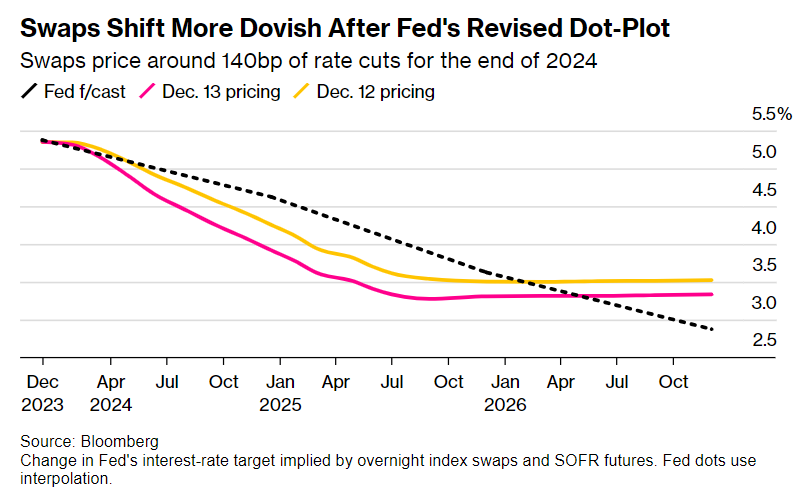
Meanwhile, they expect further rate cuts by 2025 to 3.6 percent, and Fed funds are discounting 6 rate cuts by the Fed in 2024. The ECB, in line with the Fed's choices, has also decided not to increase tightening.
Thus, interest rates on main refinancing operations, marginal lending operations, and deposits with the ECB will remain unchanged at 4.50 percent, 4.75 percent, and 4.00 percent, respectively.
According to the data shown by Eurosystem experts, eurozone inflation is expected to decline gradually over the next year and then approach the 2 percent target in 2025.
What Now?
Taking the Dow Jones Industrial Average, we can see how it has reached new all-time highs, and also more stocks have recorded new 52-week highs.
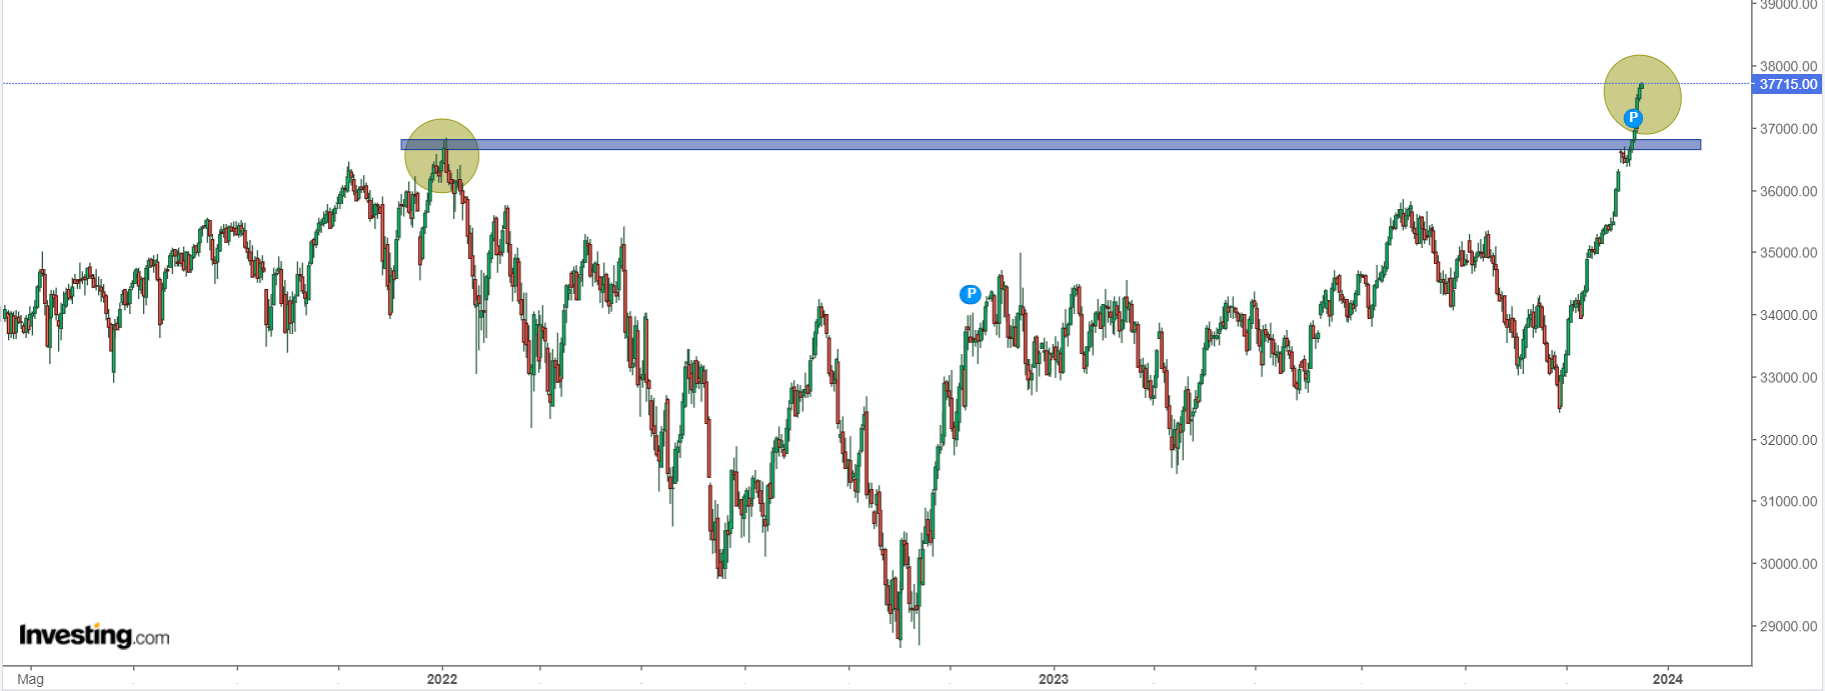
During the bull market that has persisted for over a year, some individuals have spent the entire year searching for reasons to adopt a bearish stance and position themselves against the equity trend.
The question remains: Are you still not convinced? The stock market continues to exhibit a broadly defined bullish trend.
Perhaps it's time to shift our focus to observing the market's actual behavior instead of getting entangled in various considerations.
Even with advanced knowledge of news, predicting market reactions remains challenging due to the myriad variables at play.
While certain variables hold more significance than others—knowing future inflation rates, for instance—navigating market dynamics involves grappling with a multitude of unpredictable factors.
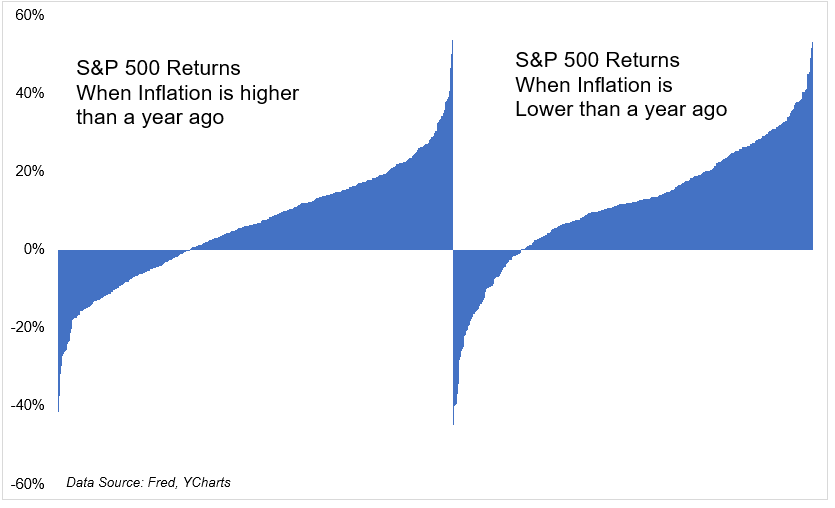
The chart above might look the same, but the S&P 500 has an average annual return of 6.3% when inflation is higher than in the previous year and 11.8% when it is lower.
In addition, the number of negative years, and thus sharp declines, is much more present with high inflation (33%), which in the coming years, projections in hand, should not be there.
Meanwhile, those expecting rises in December as well are hoping for a weaker dollar. And December, in the past 40 years, has been the worst month of the year for the US dollar. 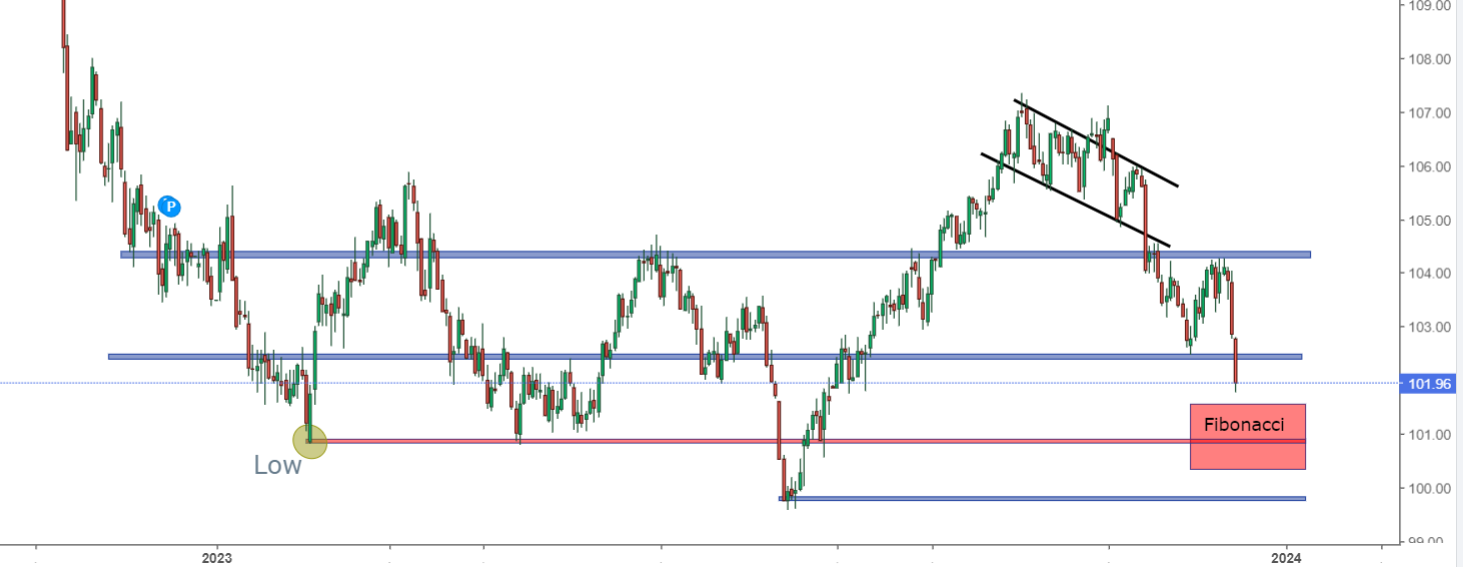
The greenback has been falling since October; a break of 102.5 suggests further weakness toward the February lows, inside the Fibonacci retracement area.
A drop to the previous lows would undoubtedly bring a tailwind to equities and a subsequent area of focus going to the July low at 99.5.
While we were to consider a historical statistic, among the many present, the chart below shows periods of extreme outperformance of the S&P 500 market-cap weighted over equally weighted stocks.
Four examples: 1973, 1990, 1999, and 2020 excluding this year where it shows that narrow leadership, such as that of the Magnificent 7, is often followed by bad years. 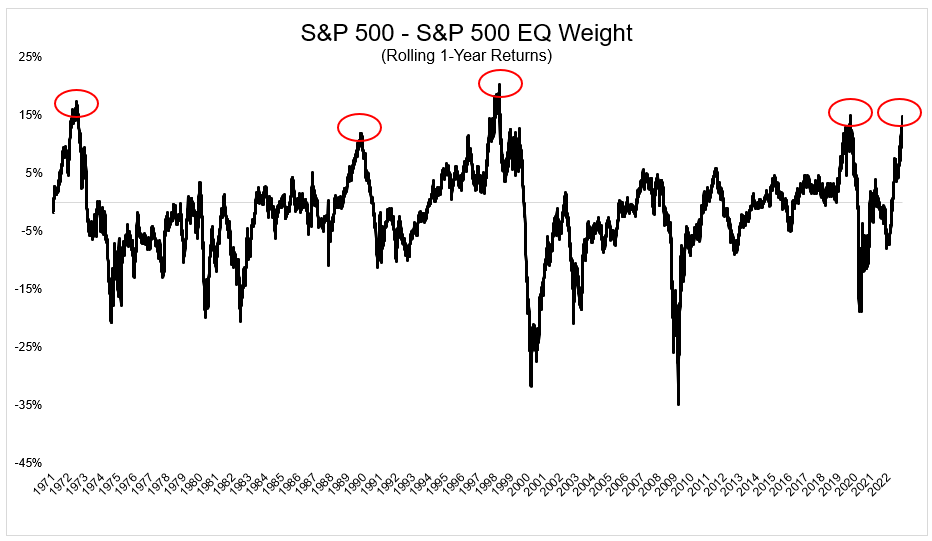
Is 2024 destined to be just another unexceptional year? Perhaps it's time to concentrate on the price trend to find out.
***
You can easily determine whether a company is suitable for your risk profile by conducting a detailed fundamental analysis on InvestingPro according to your criteria. This way, you will get highly professional help in shaping your portfolio.
In addition, you can sign up for InvestingPro, one of the most comprehensive platforms in the market for portfolio management and fundamental analysis, much cheaper with the biggest discount of the year (up to 60%), by taking advantage of our extended Cyber Monday deal.
Disclaimer: This article is written for informational purposes only; it does not constitute a solicitation, offer, advice, or recommendation to invest as such it is not intended to incentivize the purchase of assets in any way. I would like to remind you that any type of asset, is evaluated from multiple points of view and is highly risky and therefore, any investment decision and the associated risk remains with the investor.

