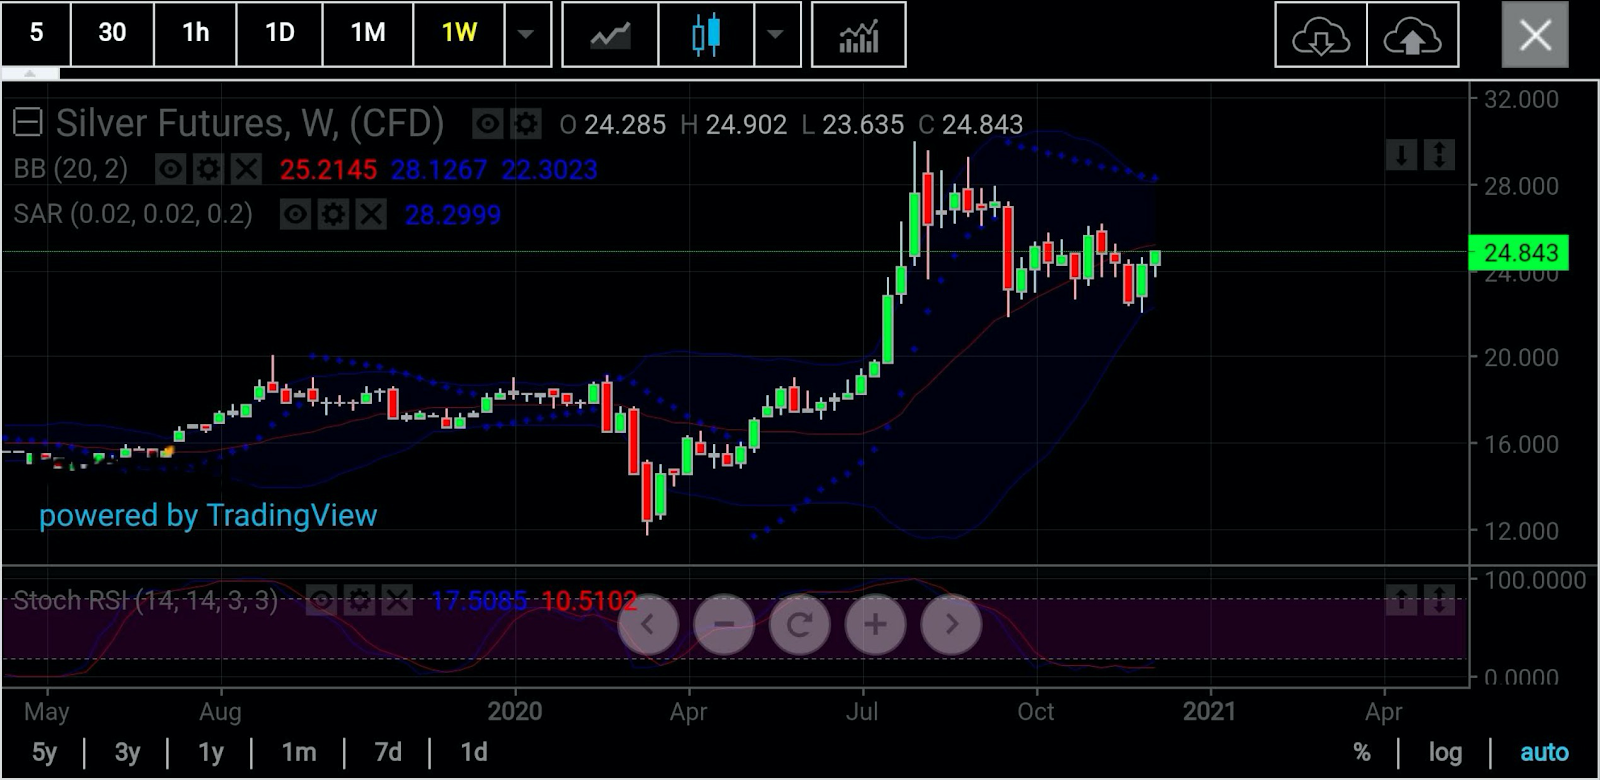
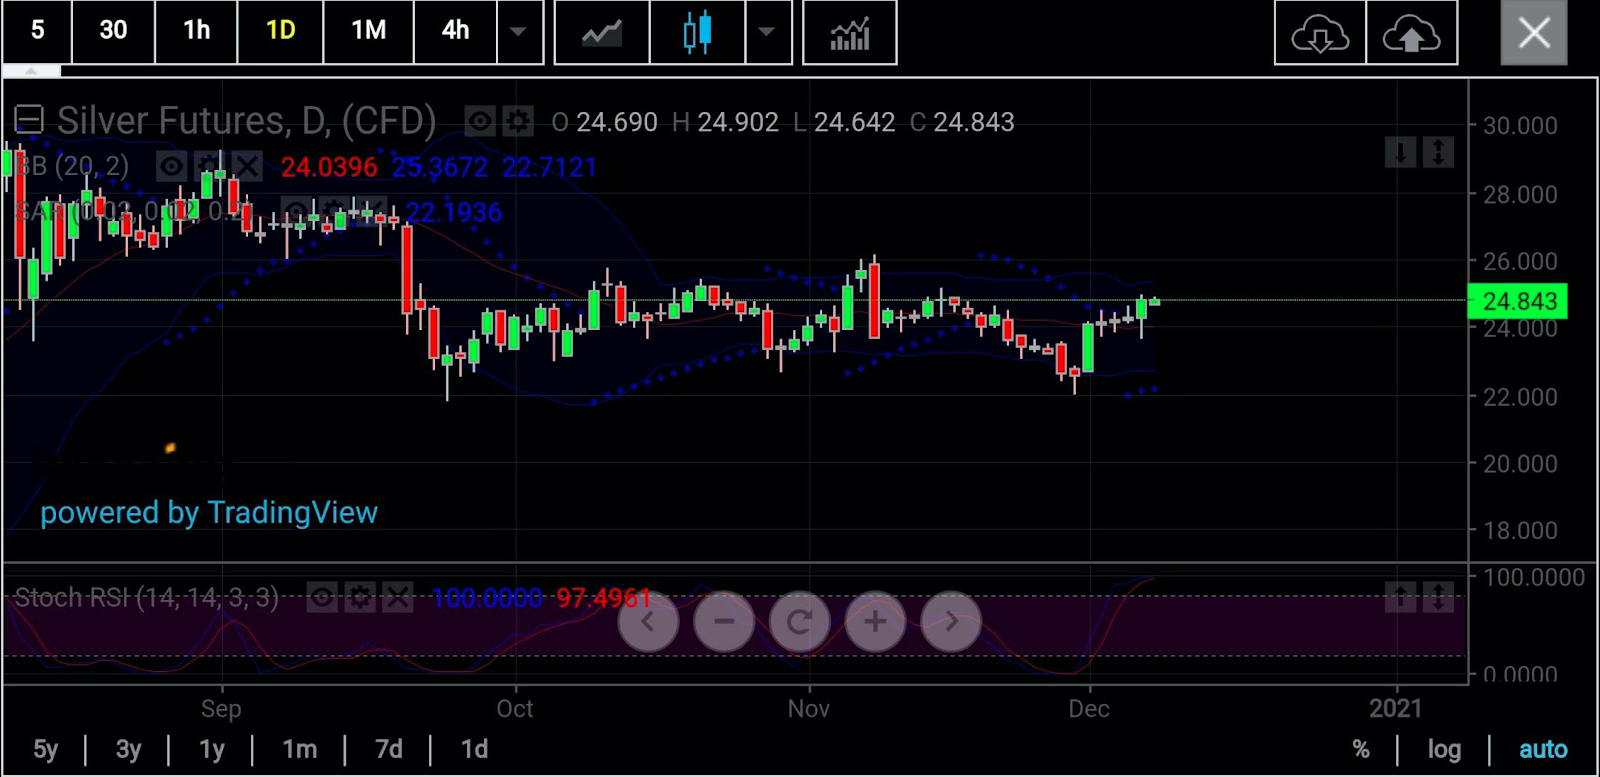
Both are overbought, but for speculators looking for a final chance of a breakout in precious metals, such technicals might not matter. What would matter is if gold got to $1,900 an ounce, then charts show silver could rally to $26.
In Tuesday’s Asian trade, benchmark gold futures for February delivery on New York’s COMEX traded as high as $1,875.95, barely $25 from the immediate $1,900 target sought by longs.
COMEX silver futures for March, meanwhile, hit a session high of $24.891, setting it within a $1.20 striking range of $26.
There is no timeline on how long it would take for either metal to hit its desired target.
One thing is certain though: gold is the catalyst in this move and silver the follower. And gold’s momentum is driven by one thing: expectations that the US Congress will agree on a COVID-19 fiscal deal over the next 48 hours.
While news of a coronavirus fiscal stimulus may be the current driver for gold’s upside, charts also show the yellow metal in a vantage position for $1,900.
In just eight sessions, COMEX gold has gone from a four-month low of $1,776.50 to Tuesday’s peak of $1,875.95. That $100 gain has energized gold’s technicals, chartist Pablo Piovano said in a blog on FX Street.
Piovani explains:
“(The) uptick in prices of the ounce troy of gold was amidst rising open interest and volume, opening the door to the continuation of the upside momentum, at least in the very near-term. That said, the mid-November tops in the $1,900 area emerge as the next hurdle of note.”
Gold is emerging from one of its most brutal sell-offs ever after breakthroughs in COVID-19 vaccines, and their potential availability before Christmas caused a run on money in safe-havens.
The yellow metal lost about 6% of its value in November, its most in a single month since 2016, and fell into $1,700 territory. Investors have in recent weeks directed money mostly into stock markets and other risk assets such as oil, as those rallied amid the notion that vaccines and therapeutics would soon bring an end to the spread of the coronavirus.
Despite the continued emphasis on risk, gold as a haven is rallying again on talk of a new US COVID-19 stimulus effort, which triggered a plunge in the dollar, the alternative trade to the yellow metal. The Dollar Index hit a six-year low of 90.47 on Monday.
Last week alone, COMEX gold for February gained almost $60, or 3.3%. It was the yellow metal’s best week since the week ended Oct. 30, and erased a significant portion of the previous week’s near 5% loss, which was the biggest weekly plunge since July.
In March, the US Congress passed the Coronavirus Aid, Relief and Economic Security (CARES) Act, dispensing roughly $3 trillion as paycheck protection for workers, loans and grants for businesses and other personal aid for qualifying citizens and residents.
In the past few months, however, Democrats in Congress have been locked in a bitter debate with Republicans in the Senate on a successive relief plan to the CARES Act. The dispute has basically been over the size of the next stimulus as thousands of Americans, particularly those in the airline sector, risked losing their jobs without further aid.
The stalemate was finally broken last week after a bipartisan group of Democrats and Republicans proposed a $908 billion relief bill, which the two sides have been negotiating since.
Anil Panchal, a silver chartist who also blogs on FX Live, notes that the metal’s sustained break of a three-week-old falling trend line currently propels it toward the upper line of a wedge at around $25.
He adds:
“If at all the bulls manage to cross $25, November’s high near $26 should return to the charts.”

Charts courtesy of SK Dixit Charting
Sunil Kumar Dixit of Kolkata, India-based SK Dixit Charting concurs with that. In an email to Investing.com, Dixit notes that silver has consolidated its base above $23.60, steadied above $24.30 and is headed for a test of the $24.90-$25.20 mark.
“Going forward, silver has more reasons to be heading towards $25.90-$26.00 areas than losing steam and turning bearish below $23.50.”

Investing.com’s own Daily Technical Indicator for gold suggests a “Strong Sell,” with Fibonacci resistance first at $1,873.01, then at $1,884.39 and later at $1,902.80.
As for silver, Investing.com’s Daily Technical Indicator also has a “Strong Buy,” pegging Fibonacci resistance first at $24.96, then at $25.27 and later at $25.77.
As with all projections, we urge you to follow the calls but temper them with fundamentals—and moderation—whenever possible.
Dislcaimer: Barani Krishnan uses a range of views outside his own to bring diversity to his analysis of any market. He does not own or hold a position in the commodities or securities he writes about.
