- Nvidia's stock has skyrocketed, briefly surpassing Apple for the world's second-most valuable company.
- Fueled by the AI boom, Nvidia boasts impressive financials and analyst upgrades.
- However, technical indicators hint at a possible pullback, hinting at a possible buying opportunity at lower levels.
- Invest like the big funds for under $9/month with our AI-powered ProPicks stock selection tool. Learn more here>>
Nvidia (NASDAQ:NVDA) shares rocketed nearly 30% in May, completely erasing April's decline and adding a staggering $700 billion to its market capitalization. This meteoric rise propelled the AI-behemoth to the third-largest company in the world, narrowing the gap with Apple (NASDAQ:AAPL) to a "mere" $250 billion.
AI Can Help Maximize Your Gains in June
A new month looms for the markets and it could present a golden opportunity to snag undervalued stocks poised for explosive growth. But how do you identify these hidden gems before everyone else?
Introducing ProPicks: Our cutting-edge AI analyzes mountains of data to pinpoint high-potential stocks before the market reacts.
Stop missing out! Subscribe to ProPicks today, and:
- Unearth hidden opportunities: Leverage AI to identify undervalued stocks with explosive growth potential.
- Stay ahead of the curve: Get a monthly list of AI-picked buys and sells before the market reacts.
- Gain an edge: Make informed investment decisions with powerful data and insights.
Subscribe to ProPicks and start building your wealth today!
Nvidia Races for Top Spot, Fueled by AI Boom
Nvidia is on a fast track to becoming the world's second most valuable company, propelled by the surging demand for artificial intelligence. While its competitors grapple with various challenges, Nvidia has capitalized on this trend with its cutting-edge AI chipsets.
The company has outpaced its rivals, becoming the go-to provider for tech giants like Alphabet (NASDAQ:GOOG), Microsoft (NASDAQ:MSFT), Tesla (NASDAQ:TSLA), and OpenAI, the developers behind ChatGPT.
This strategic positioning has fueled Nvidia's profitability, which has seen a dramatic increase in recent years.
InvestingPro data reveals a clear upward trajectory in Nvidia's revenue and profitability. Let's delve deeper into these impressive numbers.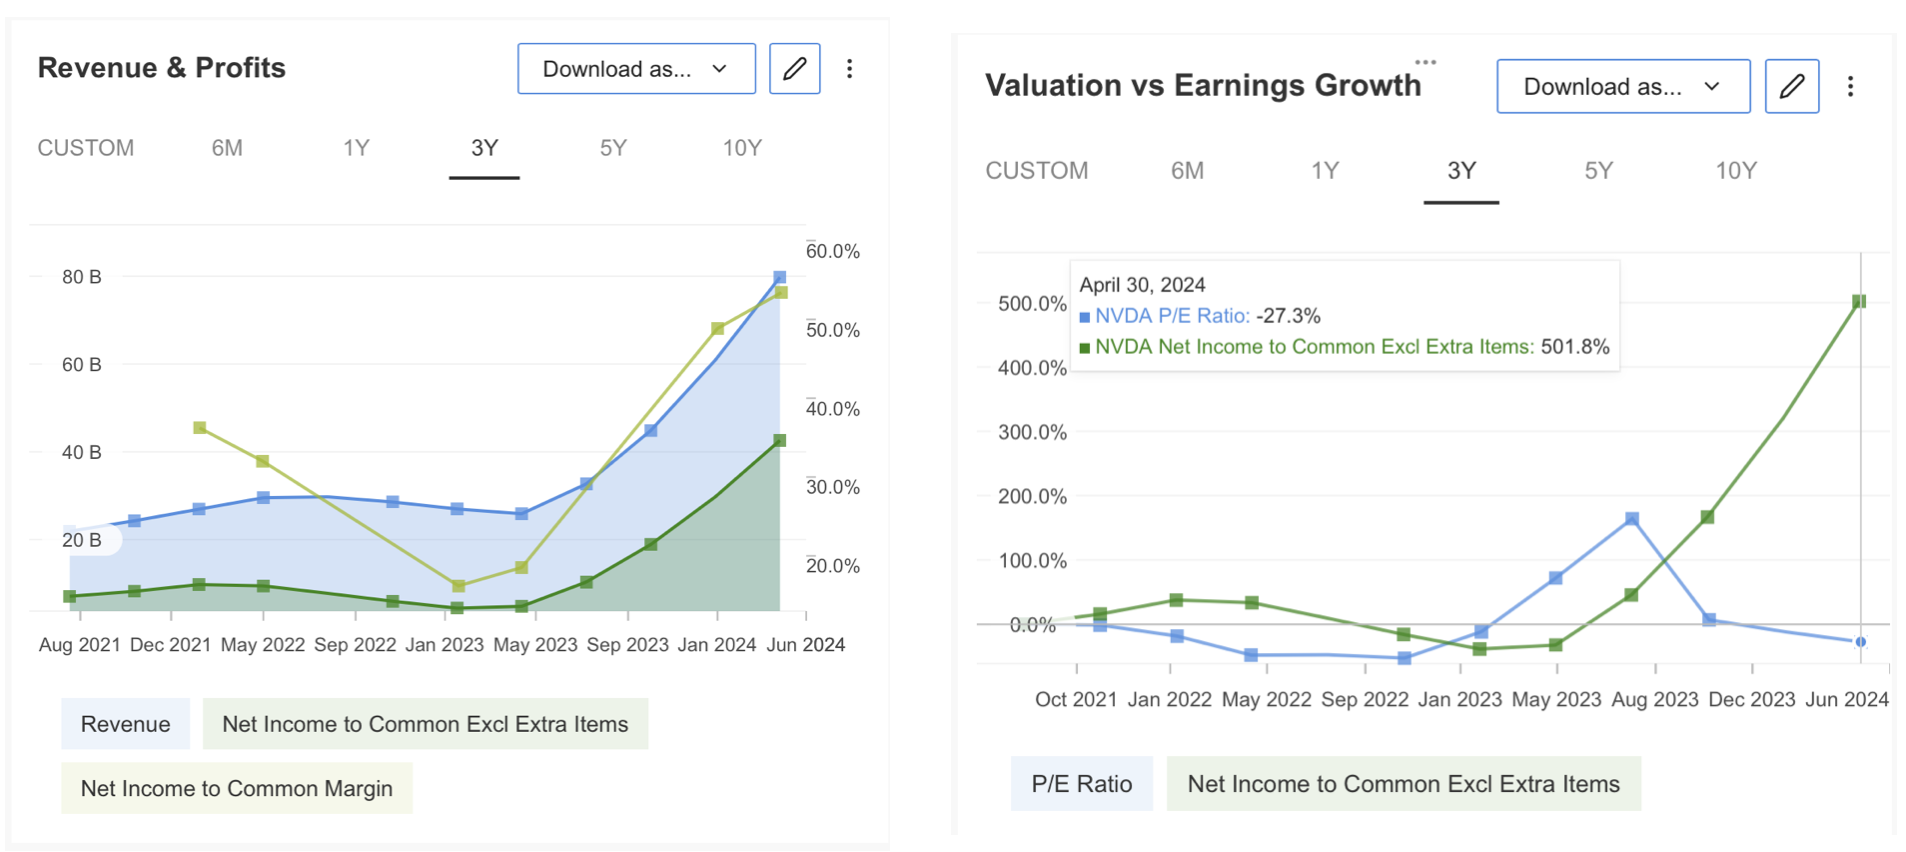
Source: InvestingPro
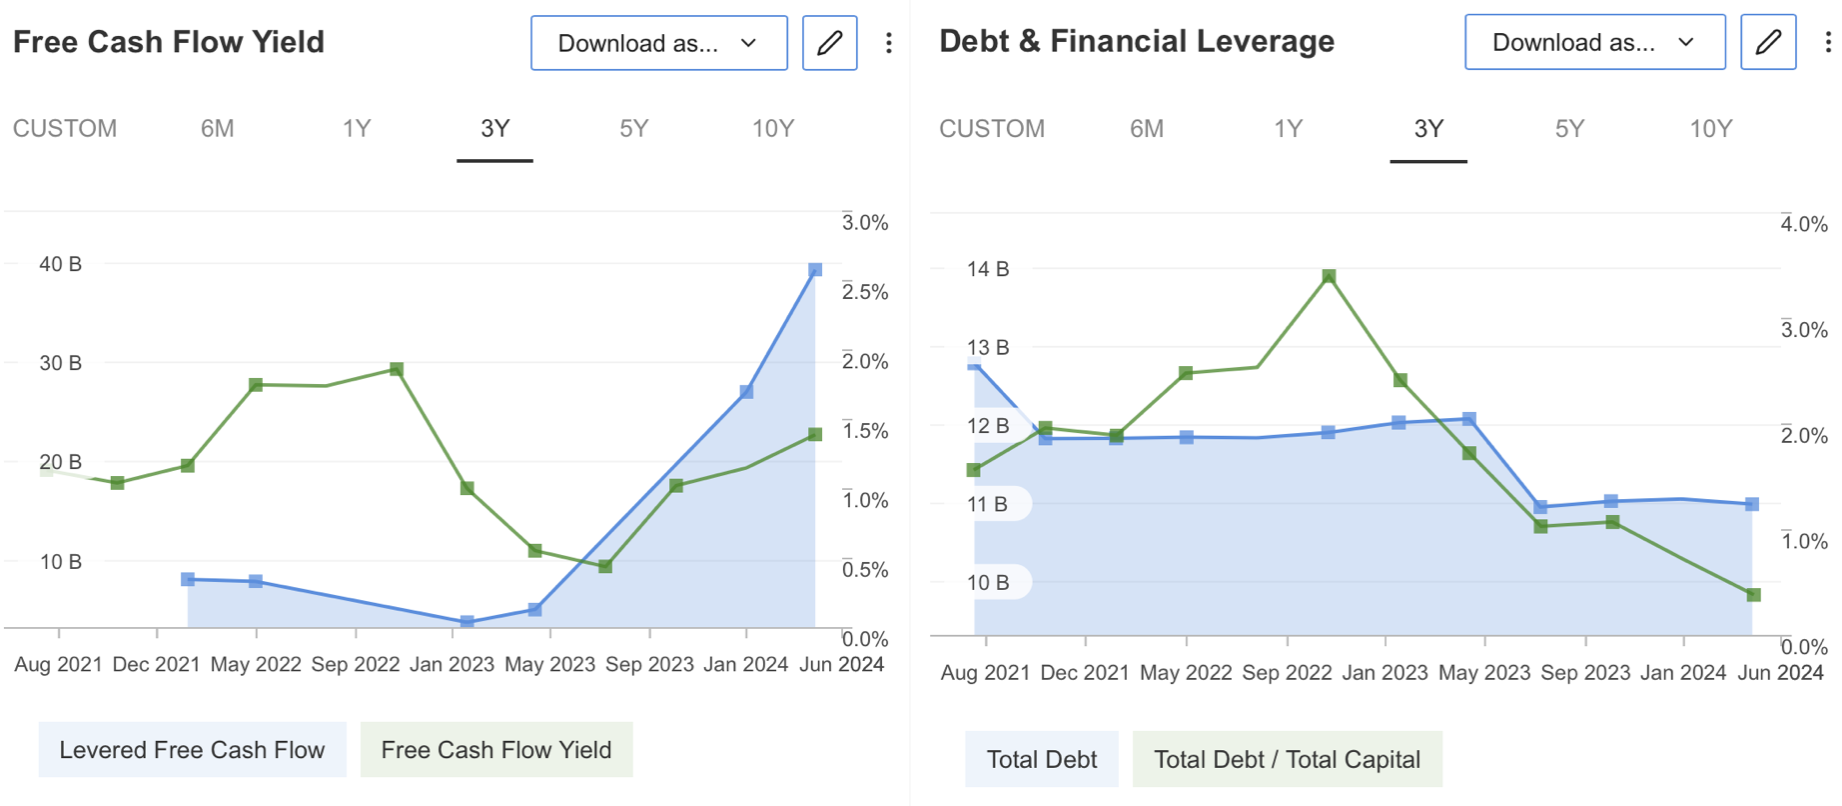
The company reduced its total debt while recording a significant improvement in cash flow over the last one-year period. Thus, while the total debt/total capital ratio decreased during the period when the capital increase accelerated, it became financially reassuring to its investors.
Source: InvestingPro
As a result of the leap seen in Nvidia in the last year, it is seen that the company's financial health report received the highest rating in InvestingPro.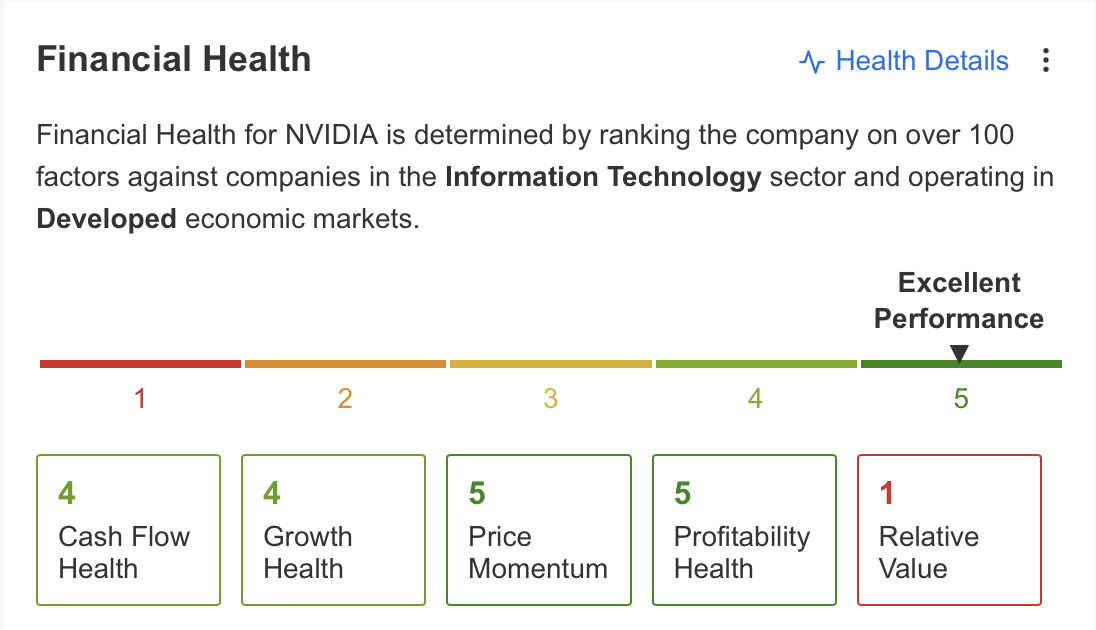
Source: InvestingPro
Nvidia's Growth Streak: Can It Continue?
Nvidia has experienced a period of explosive growth, but can this momentum be sustained? To answer that question, let's examine analyst estimates surrounding the company's financial valuation.
A bullish outlook dominates the near future. 37 analysts have revised their expectations upwards for Nvidia's upcoming August earnings report.
The consensus estimate predicts a staggering 159% increase in net profit per share, reaching $6.35. Revenue is also expected to surge by 112% year-on-year, potentially reaching $28.32 billion. 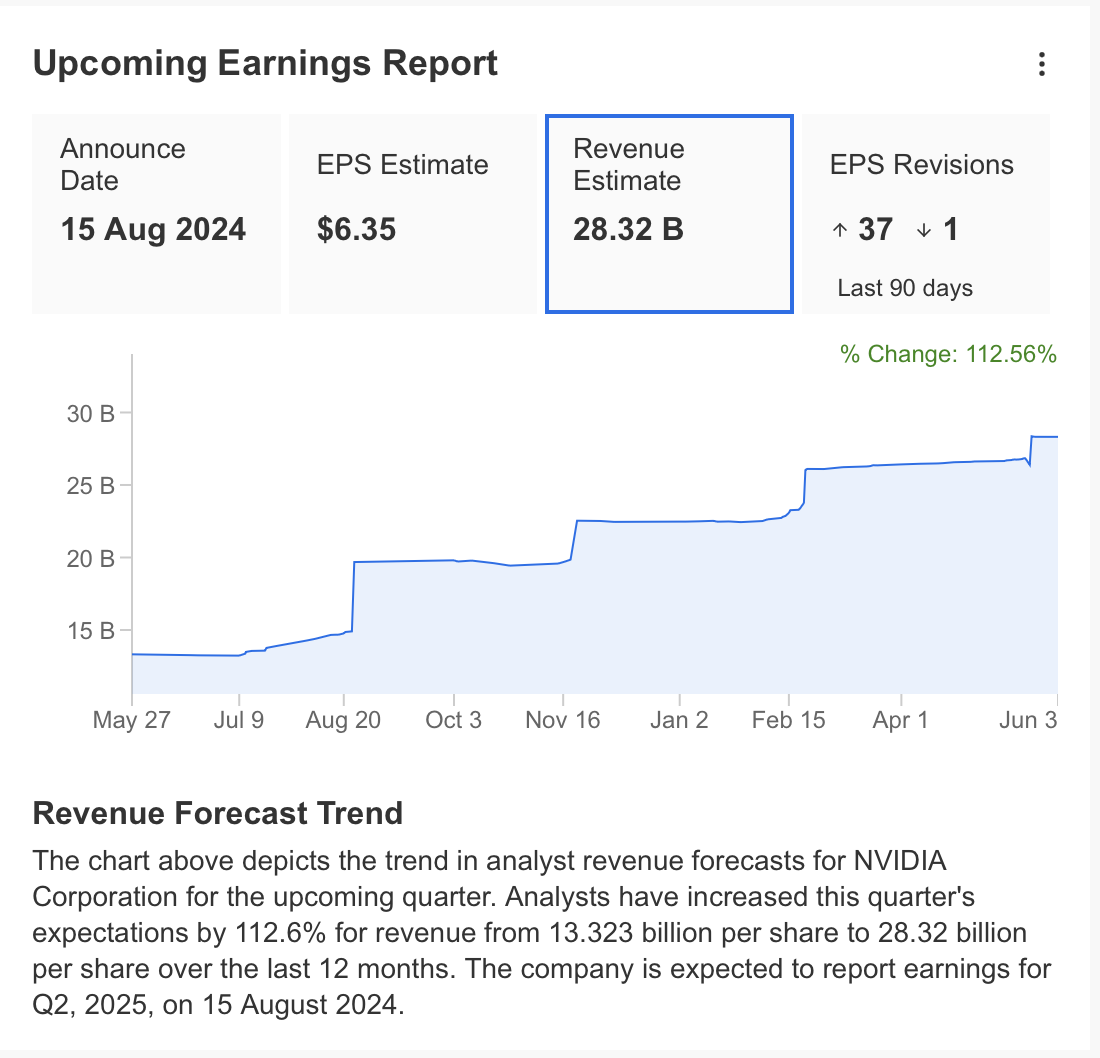
Source: InvestingPro
The forecast continues to shine brightly for Nvidia in the long term. Analysts anticipate a robust 108% year-on-year increase in EPS, potentially reaching $27 by the beginning of 2025.
While the pace of growth may moderate in the coming years, the outlook remains positive. By the end of 2024, annual revenue is projected to approach $120 billion, representing a remarkable near-100% increase. 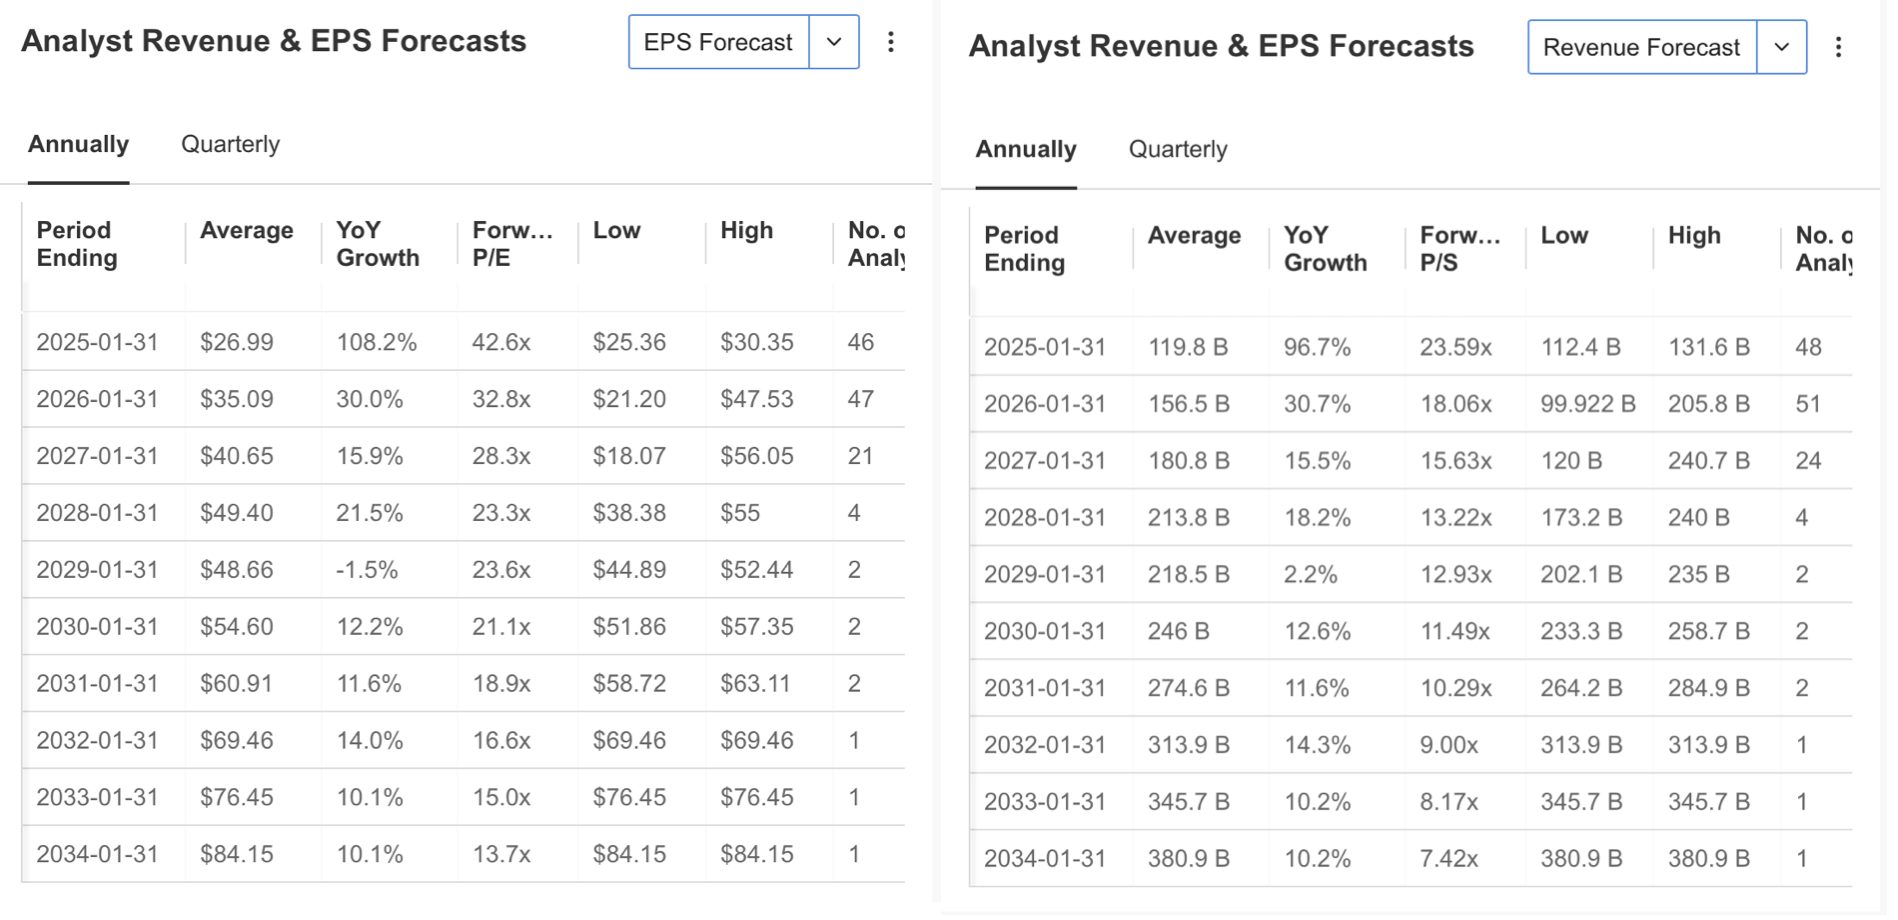
Source: InvestingPro
Nvidia Stock: Technical Analysis Points to Potential Pullback
Nvidia has enjoyed a phenomenal run, surging 130% this year and a staggering 720% since the start of 2023. However, despite strong financials and high valuation ratios, some technical indicators suggest a potential correction on the horizon.
Both the RSI (Relative Strength Index) and high volatility levels signal that NVDA might be overbought. This suggests the stock may be due for a pullback from its current price of around $1,150.
InvestingPro's analysis, incorporating 13 financial models, estimates a potential 16% pullback, with a fair value closer to $950. However, 49 analysts remain bullish, with a consensus price target of $1,200.
While NVDA has seen significant gains, it's worth noting the lack of major corrections in the past year. The most significant pullback occurred in April, followed by a swift recovery.
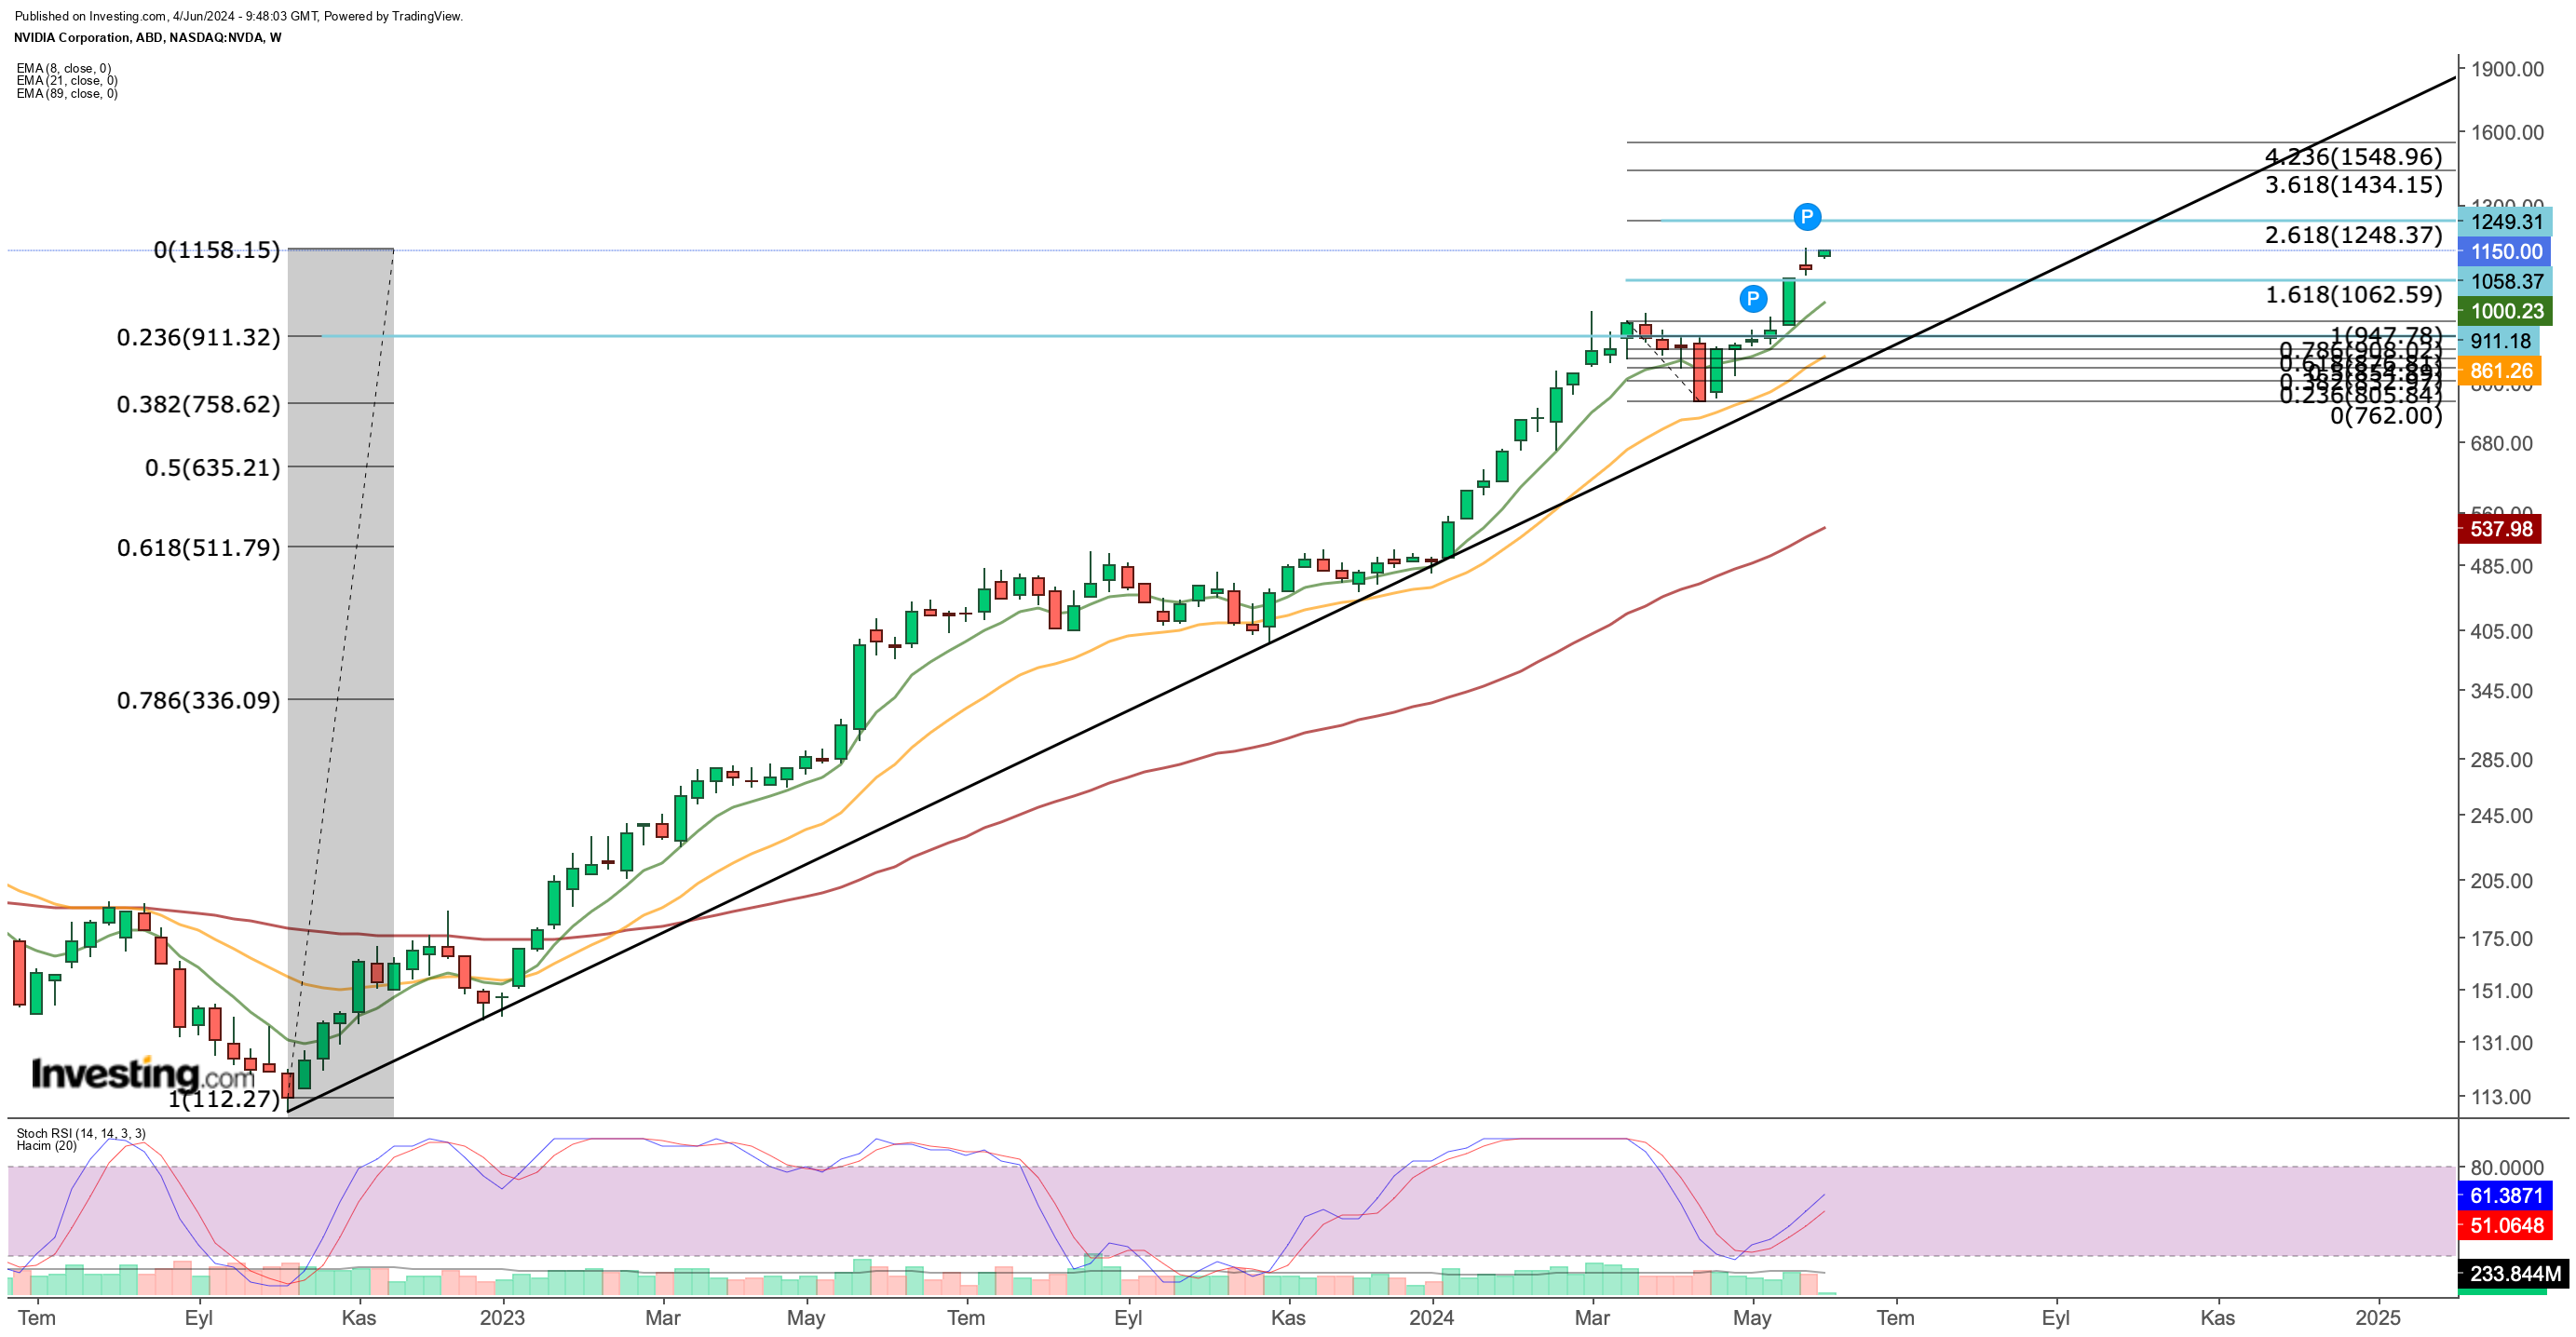
The Stochastic RSI recently reversed from oversold territory, suggesting a potential short-term rise toward $1,250. A more medium-term target could be $1,430.
However, if profit-taking intensifies, the first support level sits at $1,060. Weekly closes below this level could see a more prolonged correction, potentially dragging the price down to $910, aligning with the long-term trend.
While NVDA's future remains bright, technical indicators suggest a potential pullback. Investors should be aware of these signals and consider risk management strategies.
***
Take your investing game to the next level in 2024 with ProPicks
Institutions and billionaire investors worldwide are already well ahead of the game when it comes to AI-powered investing, extensively using, customizing, and developing it to bulk up their returns and minimize losses.
Now, InvestingPro users can do just the same from the comfort of their own homes with our new flagship AI-powered stock-picking tool: ProPicks.
With our six strategies, including the flagship "Tech Titans," which outperformed the market by a lofty 1,745% over the last decade, investors have the best selection of stocks in the market at the tip of their fingers every month.
Subscribe here and never miss a bull market again!

Don't forget your free gift! Use coupon codes OAPRO1 and OAPRO2 at checkout to claim an extra 10% off on the Pro yearly and bi-yearly plans.
Disclaimer: This article is written for informational purposes only; it does not constitute a solicitation, offer, advice, or recommendation to invest as such it is not intended to incentivize the purchase of assets in any way. I would like to remind you that any type of asset, is evaluated from multiple points of view and is highly risky and therefore, any investment decision and the associated risk remains with the investor.
