This week, it was the IMFs turn to downgrade their global growth projections, which they did on October 6:
The IMF’s latest World Economic Outlook (WEO) foresees lower global growth compared to last year, with modest pickup in advanced economies and a slowing in emerging markets, primarily reflecting weakness in some large emerging economies and oil-exporting countries.
“Despite considerable differences in country-specific outlooks, the new forecasts mark down expected near-term growth marginally but nearly across the board. Moreover, downside risks to the world economy appear more pronounced than they did just a few months ago,” Obstfeld said.
The IMFs observations are part and parcel of what other analyst have noted for the last few months: China’s slowdown has transmitted to emerging markets, which is having a slightly negative effect on developed economies. Other data confirmed the slowdown and general fact pattern of its internals.
The Reserve Bank of Australia maintained their 2% rate at their latest meeting. The policy release contained the following analysis of Australia’s economy:
In Australia, the available information suggests that moderate expansion in the economy continues. While growth has been somewhat below longer-term averages for some time, it has been accompanied with somewhat stronger growth of employment and a steady rate of unemployment over the past year. Overall, the economy is likely to be operating with a degree of spare capacity for some time yet, with domestic inflationary pressures contained. Inflation is thus forecast to remain consistent with the target over the next one to two years, even with a lower exchange rate.
Like other developed economies, Australia has little inflationary pressure:
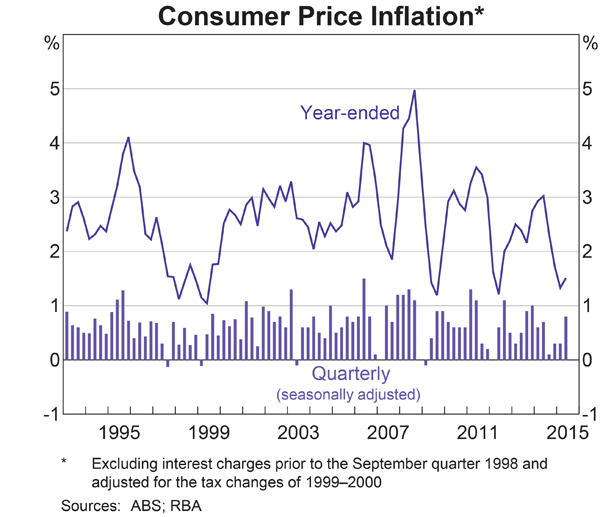
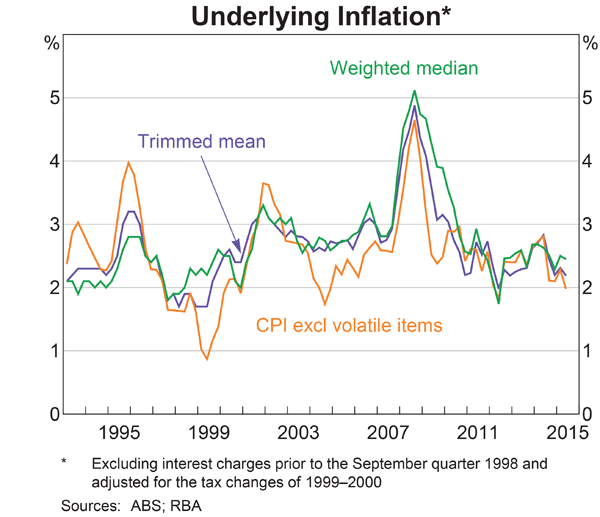
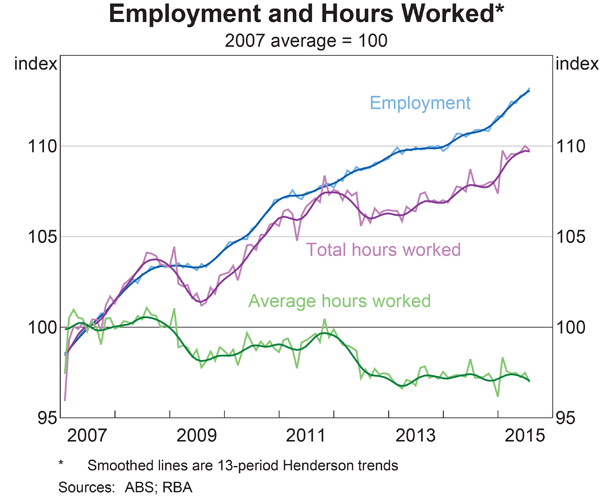
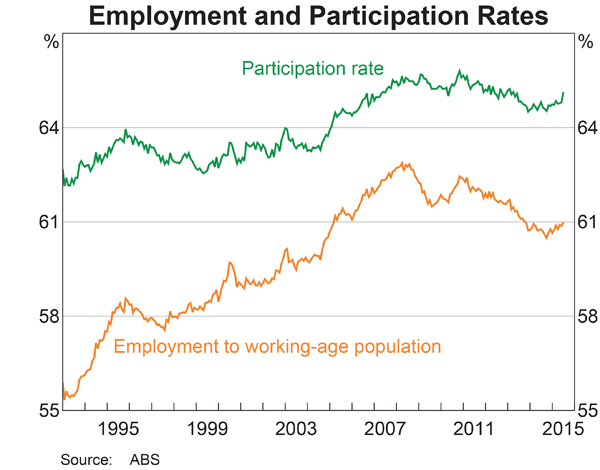
Total CPI (top chart) is ~1.4% while “non-volatile” CPI (bottom chart) is ~2%. And while the unemployment rate has been steady for about a year at slightly above 6%, total employment and the employment/population ratio is increasing:
The Australian Industry Group (AIG) released their monthly activity indexes. Manufacturing printed at 52.1, registering an expansion for four consecutive months.Half the sub-sectors increased while six of seven sub-indexes were up. The Services sector increased for the fourth consecutive month, which hasn’t happened since 2008. 3/5 of the sub-indicators gained while 6/9 service sectors expanded. And finally, the construction sector recorded its second consecutive month of expansion, with a 51.9 reading. Australian statistics have vacillated between barely negative and barely positive for the last few years. In the last few weeks, they have moved to a “moderate growth” level.
The ECB released their latest Minutes. Due to weaker international markets, they lowered growth projections to 1.4% in 2014, 1.7% in 2015 and 1.8% in 2016. More important was the downward revision for inflation:
The September 2015 ECB staff macroeconomic projections foresaw HICP inflation to average 0.1% in 2015 and to pick up to 1.1% in 2016 and 1.7% in 2017. In comparison with the June 2015 Eurosystem staff projections, the outlook for HICP inflation had been revised down, largely owing to lower oil prices. Also taking into account the developments in oil prices and exchange rates after the cut-off date for the technical assumptions of 12 August, there were downside risks to the September staff inflation projections.
As regards longer-term inflation expectations, market-based measures had declined again over the summer, following the recovery from their troughs in mid-January. For example, the five-year forward inflation-linked swap rate five years ahead stood at 1.7% on 1 September 2015, after 1.8% in mid-July 2015. No new release of the ECB Survey of Professional Forecasters had become available since the last monetary policy meeting.
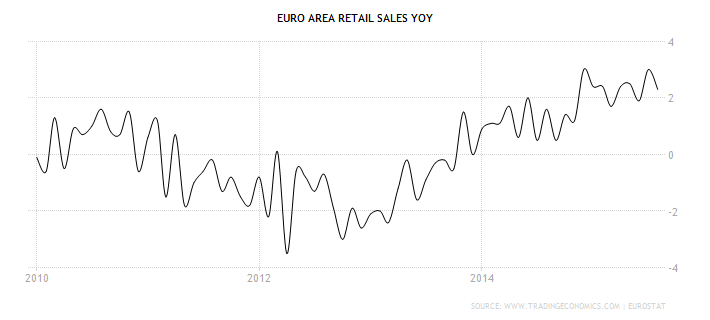
These lower projections provided ammunition to analysts who argued the ECB will increase asset purchases in the coming months. Most other news was positive. The Markit EU composite readings was 53.6, with the four largest economies all also reporting expansionary numbers (Germany was 54.1, France was 51.9, Spain was 54.6 and Italy was 53.4). All four economies also reported an increase in new orders. Other German numbers, however, were slightly concerning: exports decreased 5.25% M/M while industrial production declined 1.2% M/M. Finally, while retail sales were flat M/M, they increased 2.3% Y/Y, continuing this data series’ positive movements:
Canadian news was mostly positive. The best came from the housing sector:
Groundbreaking on new homes jumped to a seasonally adjusted annual rate of 230,701 in September from a downwardly revised 214,255 in August, a report by the Canada Mortgage and Housing Corp showed.
That puts housing starts at the highest since August 2012, bucking forecasts for a slowing in construction to 200,000 starts, which economists have said is more in line with demographic demand.
"In the span of about three months, Canadian homebuilding activity has gone from a controlled simmer to a rolling boil," BMO Capital Markets senior economist Robert Kavcic said in a research note.
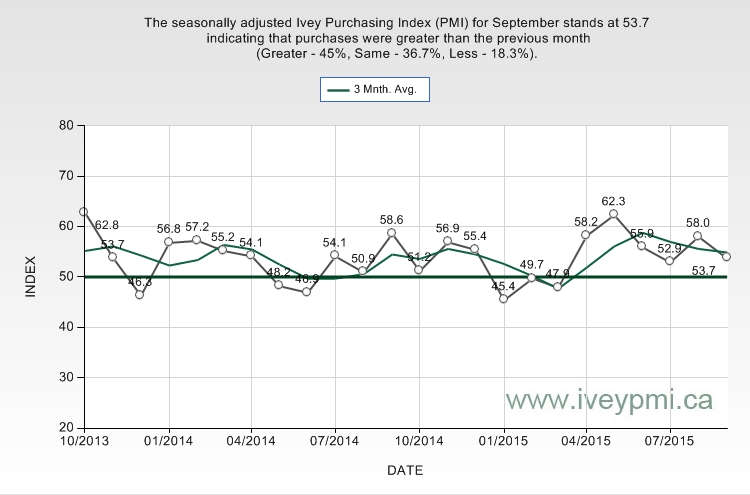
Housing starts are an important leading indicator because they employ a variety of sectors such labor, durable goods, raw materials and finance. In addition, the Ivey PMY registered 53.7, continuing this data sets positive numbers:
On the negative side, the unemployment rate slighlty increased to 7.1%. But on the positive side, more people entered the labor force, indicating increased confidence.
The Bank of Japan maintained their current rate policy and asset purchase program. But many analysts question how much longer that’s possible.
According to a Bloomberg survey, 17 out of 36 economists now expect the BoJ to move in October, up from 13 last month. Two developments have tipped the scales for those who changed their view.
First was a fall in industrial production, raising the likelihood Japan is in a technical recession, which could be confirmed by growth data in mid-November.
Second, Mr Kuroda has devoted speech after speech this year to arguing that BoJ policy works by raising public expectations of future inflation. Yet in the past few weeks those expectations have fallen notably.
Adding fuel to additional stimulus argument was a M/M drop in LEI, CEIs, and machinery orders (which declined 5.7%). After the sharp drop in 2Q GDP and the current level of weakness, it’s arguable not a matter of “if” but when the BOJ increases stimulus.
The Bank of England maintained their current rate policy. But, like the Fed, they are concerned that international developments could be problematic:
A deterioration in the global demand environment would slow the pace of expansion further. That could occur, for example, were the slowdown currently underway in a range of emerging economies, including China, to intensify. Growth in the euro area, the United Kingdom’s main trading partner, has so far remained relatively resilient. As always, the Committee will continue to monitor international developments, as well as evidence concerning the resilience of the domestic economy, to assess the outlook for inflation and activity in the United Kingdom, and set monetary policy as appropriate in the light of all of those factors.
At an earlier meeting, the Financial Policy Committee outlined in far more detail the potential negative impact of a Chinese slowdown on the UK economy. Finally, the ONS released production and manufacturing numbers: the former was up 1.9% Y/Y and 1% M/M, while manufacturing was down .8% Y/Y and up .5% M/M. Once again, the strong pound and weaker international environment are slowing global demand.
This week’s data leads to two conclusions. First, there is adequate information to state with confidence that global growth is clearly slowing. The drop in Chinese demand is slowing emerging market economies, which in turn are purchasing fewer goods and services from developed markets. Second, the commodities slowdown’s effect is intensifying. In addition to the negative impact on prices, employment growth is weakening as are some corporate earnings. While the overall impact isn’t sufficient to lead to a recession, it is clearly negative.
It appears the Fed no longer has confidence in their theory that inflation will rise with oil prices. In addition, increasing international economic volatility is keeping them on the sidelines, at least for now. While the committee obviously wants to normalize rates, they are running out of fundamental reasons for doing so.
