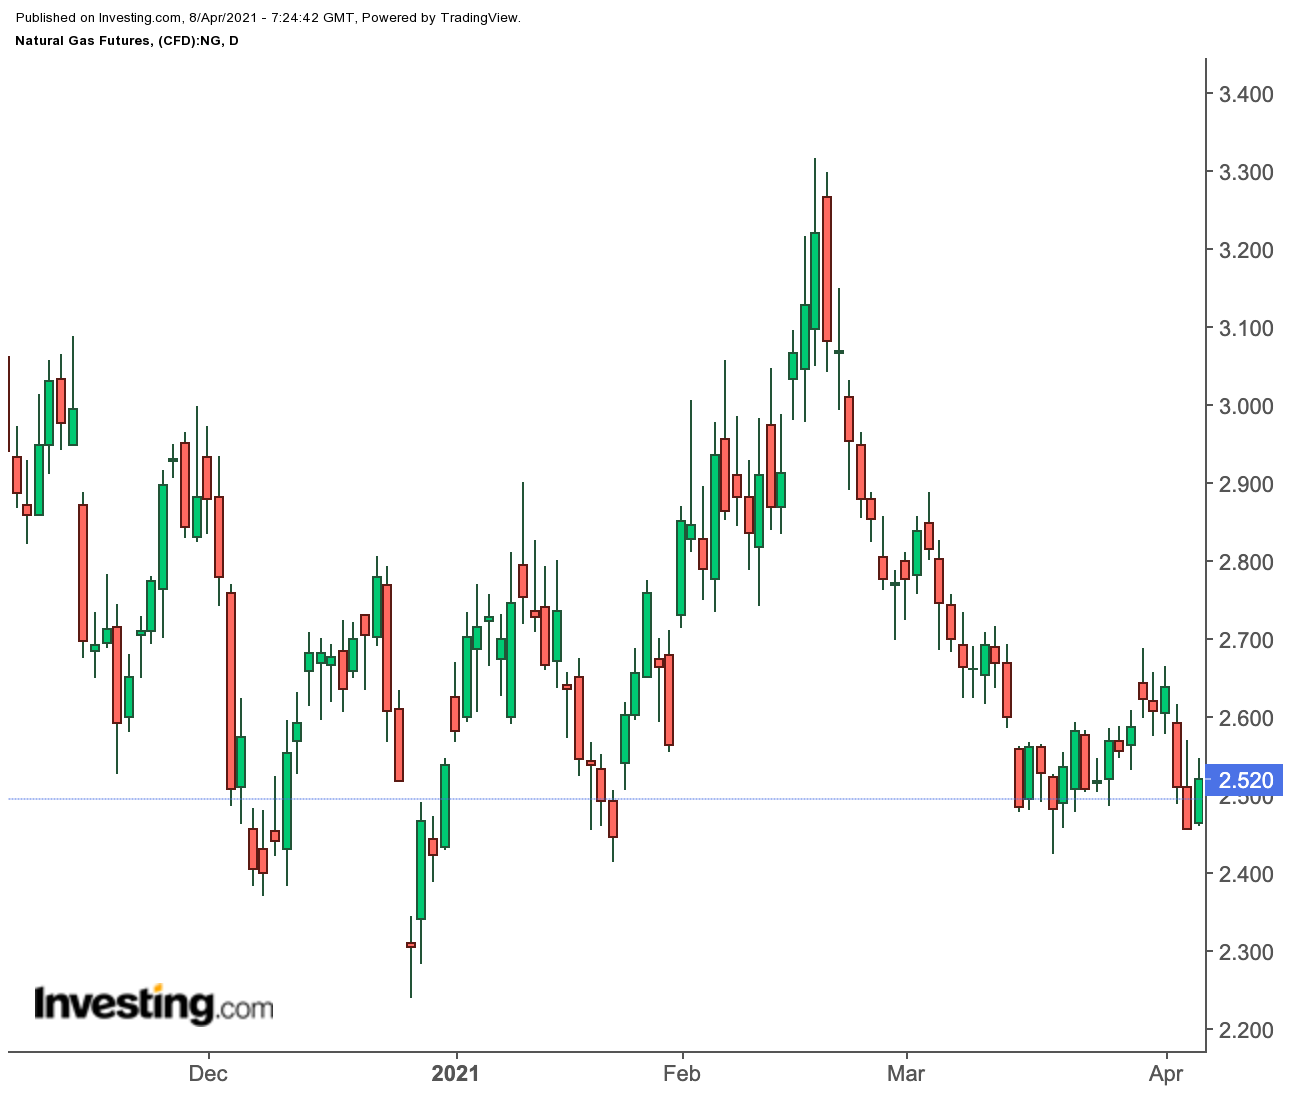
The storage injection season for natural gas is underway, indicating tepid demand for heating and cooling this spring. Yet, intermittent cold is keeping New York-traded futures of the fuel above the key $2.50 level, to the relief of those long the market.

As the US Energy Information Administration prepares to release its natural gas storage report for the week to Apr. 2 at 10:30 AM ET (14:30 GMT) today, the consensus among analysts tracked by Investing.com is for an injection of 21 bcf, or billion cubic feet.
If accurate, it would be the second injection into storage this year since the previous week’s 14 bcf build. Typically, storage builds for natural gas begin at the start of April but this year’s round began earlier in the week ended Mar. 26.
That has put pressure on gas futures on the New York Mercantile Exchange’s Henry Hub, driving the front month contract down 5% this week as market participants brace for, at best, tepid gas consumption in the near term.
More Gas Burns Forecast In Next 2 Weeks For Heat
Yet, the weather over the next two weeks indicates some unexpected chill that could lead to more burning of gas for heat, say those tracking forecasts.
That could also keep Henry Hub’s front month above the key support level of $2.50 per mmBtu, or million metric British thermal units.
Gelber & Associates, a Houston-based gas markets consultancy, said in a note issued to its clients and shared with Investing.com on Wednesday:
“NYMEX Henry Hub futures are moving up an average 5 cents across the 2021 forward curve as colder weather infiltrates the tail end of the two week forecast.”
“Although the cold is by no means extreme, below-normal temperatures are enough to generate demand. So much so, that the 30 bcf of demand that was erased from the early weather forecasts this week has almost completely returned.”
The 21-bcf storage injection forecast for last week comes as weather readings showed 100 HDDs, or heating degree days, for the week. That compared with the 103 HDDs normal for this time of year, according to data provider Refinitiv.
If the 21-bcf build is on target, the injection during the week ended Apr. 2 would take US gas stockpiles up to 1.785 trillion cubic feet (tcf), 1.3% below the five-year average and 11.6% lower than the same week a year ago.
Once the forecast 21-bcf injection passes, Gelber & Associates said it anticipates relatively large gas builds in the coming weeks.
“This is why prices are beaten down so much currently,” it said, referring to this week’s correction, the first in three weeks.
“The market now looks toward late April, when forecast colder-than-normal temperatures brush over the US and the storage injection for the week ending Apr. 23 is anticipated to be notably smaller than surrounding weekly injections.”
How long the projected cooler-than-normal pattern seen for Apr. 14-20 lasts is now of great interest, forecaster NatGasWeather said in a report posted on the naturalgasintel.com portal.
Cold Could Fade In Third Week Of April
The GFS and the European weather models see cool Eastern US air slowly fading between Apr. 21-24, although changes are likely given the long lead time, NatGasWeather said, adding:
“Of course, the pattern the next seven days before then is about as bearish as it gets, with national demand exceptionally light for this time of the year due to very limited coverage of subfreezing air.”
Bespoke Weather Services also said it viewed cooling as likely “limited” in terms of duration. The pattern may tilt back to the warmer-than-normal side toward the end of the month, it said.
Bespoke said there were only minor changes in production volumes early Wednesday, and power burns remained marginally stronger on a weather-adjusted level than they had been previously. However, burns were still weak, overall.
The forecaster said it was “neutral” as far as price action in the near term, given some “marginal improvement” in the data over the last couple of days. However, cash prices have been “very weak” and that would need to change to stimulate any sustainable move higher.
“It is possible that burns continue to gradually strengthen as well if prices remain under the $2.50 level,” Bespoke added.
Technicals Show Natural Gas A 'Strong Sell'
Technical charts of natural gas, however, suggest more downside in the near term.
Should the market extend its bearish trend, a three-tier Fibonacci support is forecast, first at $2.474, then $2.454 and later at $2.430.
In the event of a turnaround, then a three-stage Fibonacci resistance is expected to form, first at $2.542, then $2.562 and later at $2.596.
Disclaimer: Barani Krishnan uses a range of views outside his own to bring diversity to his analysis of any market. For neutrality, he sometimes presents contrarian views and market variables. He does not hold a position in the commodities and securities he writes about.
