This article was written exclusively for Investing.com
- New highs in gold in all of the leading currencies except the dollar
- The Swiss franc was the last shoe to drop
- Gold is heading for a test of the 2011 highs in dollar terms
- The potential for much higher levels is on the horizon
The gold market reached another milestone last week when the price of the precious metal hit a high of $1829.80 on the active month August COMEX futures contract. From a technical perspective, gold rose to the highest point since 2011 and above all resistance levels below the all-time high in US dollar terms at $1920.70 per ounce.
At last week’s peak, gold was less than $100 below the record level from nine years ago. At the end of the week, the price was just above the $1800 level and at the time of writing the price is 1,803.75.
One of the signs that the bull market in gold that began in the early 2000s will continue to rise is the precious metal’s performance in all currencies. Central banks worldwide hold gold as an integral part of their foreign currency reserves along with dollars, euro, and other leading foreign exchange instruments.
The central banks have been net buyers of gold over the past years. The dollar is the final currency that has yet to make a new low against gold, but that event is likely coming sooner rather than later.
New gold highs in all leading currencies except the dollar
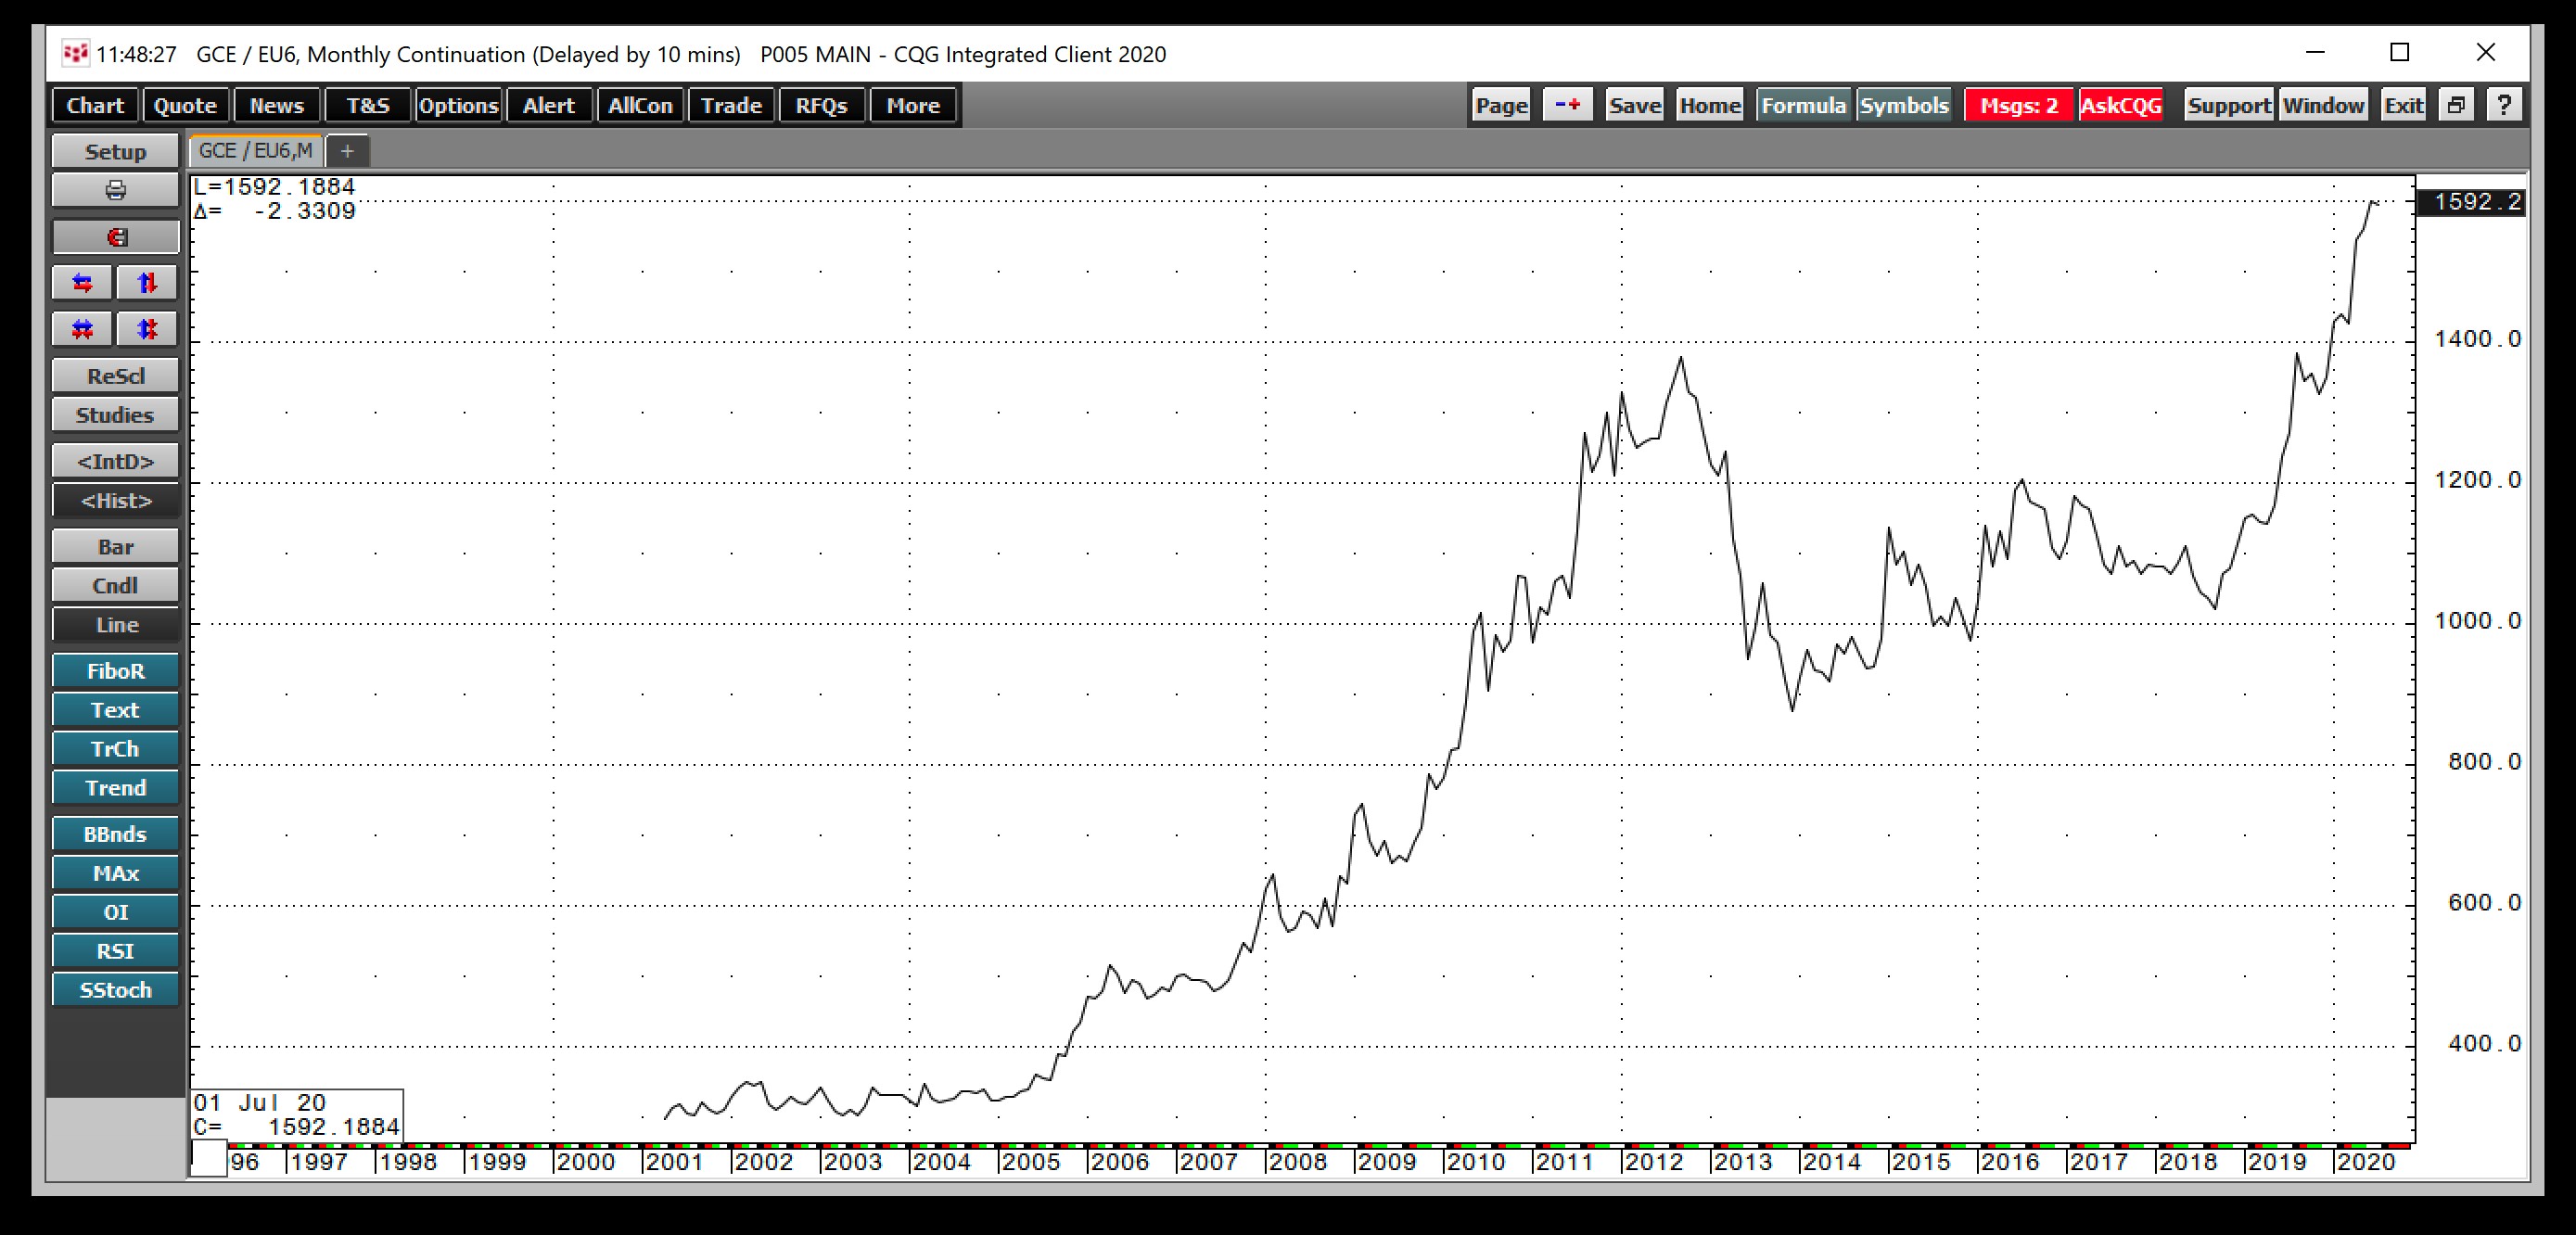
In 2019, when gold broke out to the upside above the 2016 high of $1377.50, the price of the yellow metal moved to a new record peak in a host of other currencies.
Source, all charts: CQG
As the monthly chart, above, shows, gold in euros moved above the 2012 high at €1377 in August 2019 and kept rising. The latest high was just below the 1600 euros per ounce level.
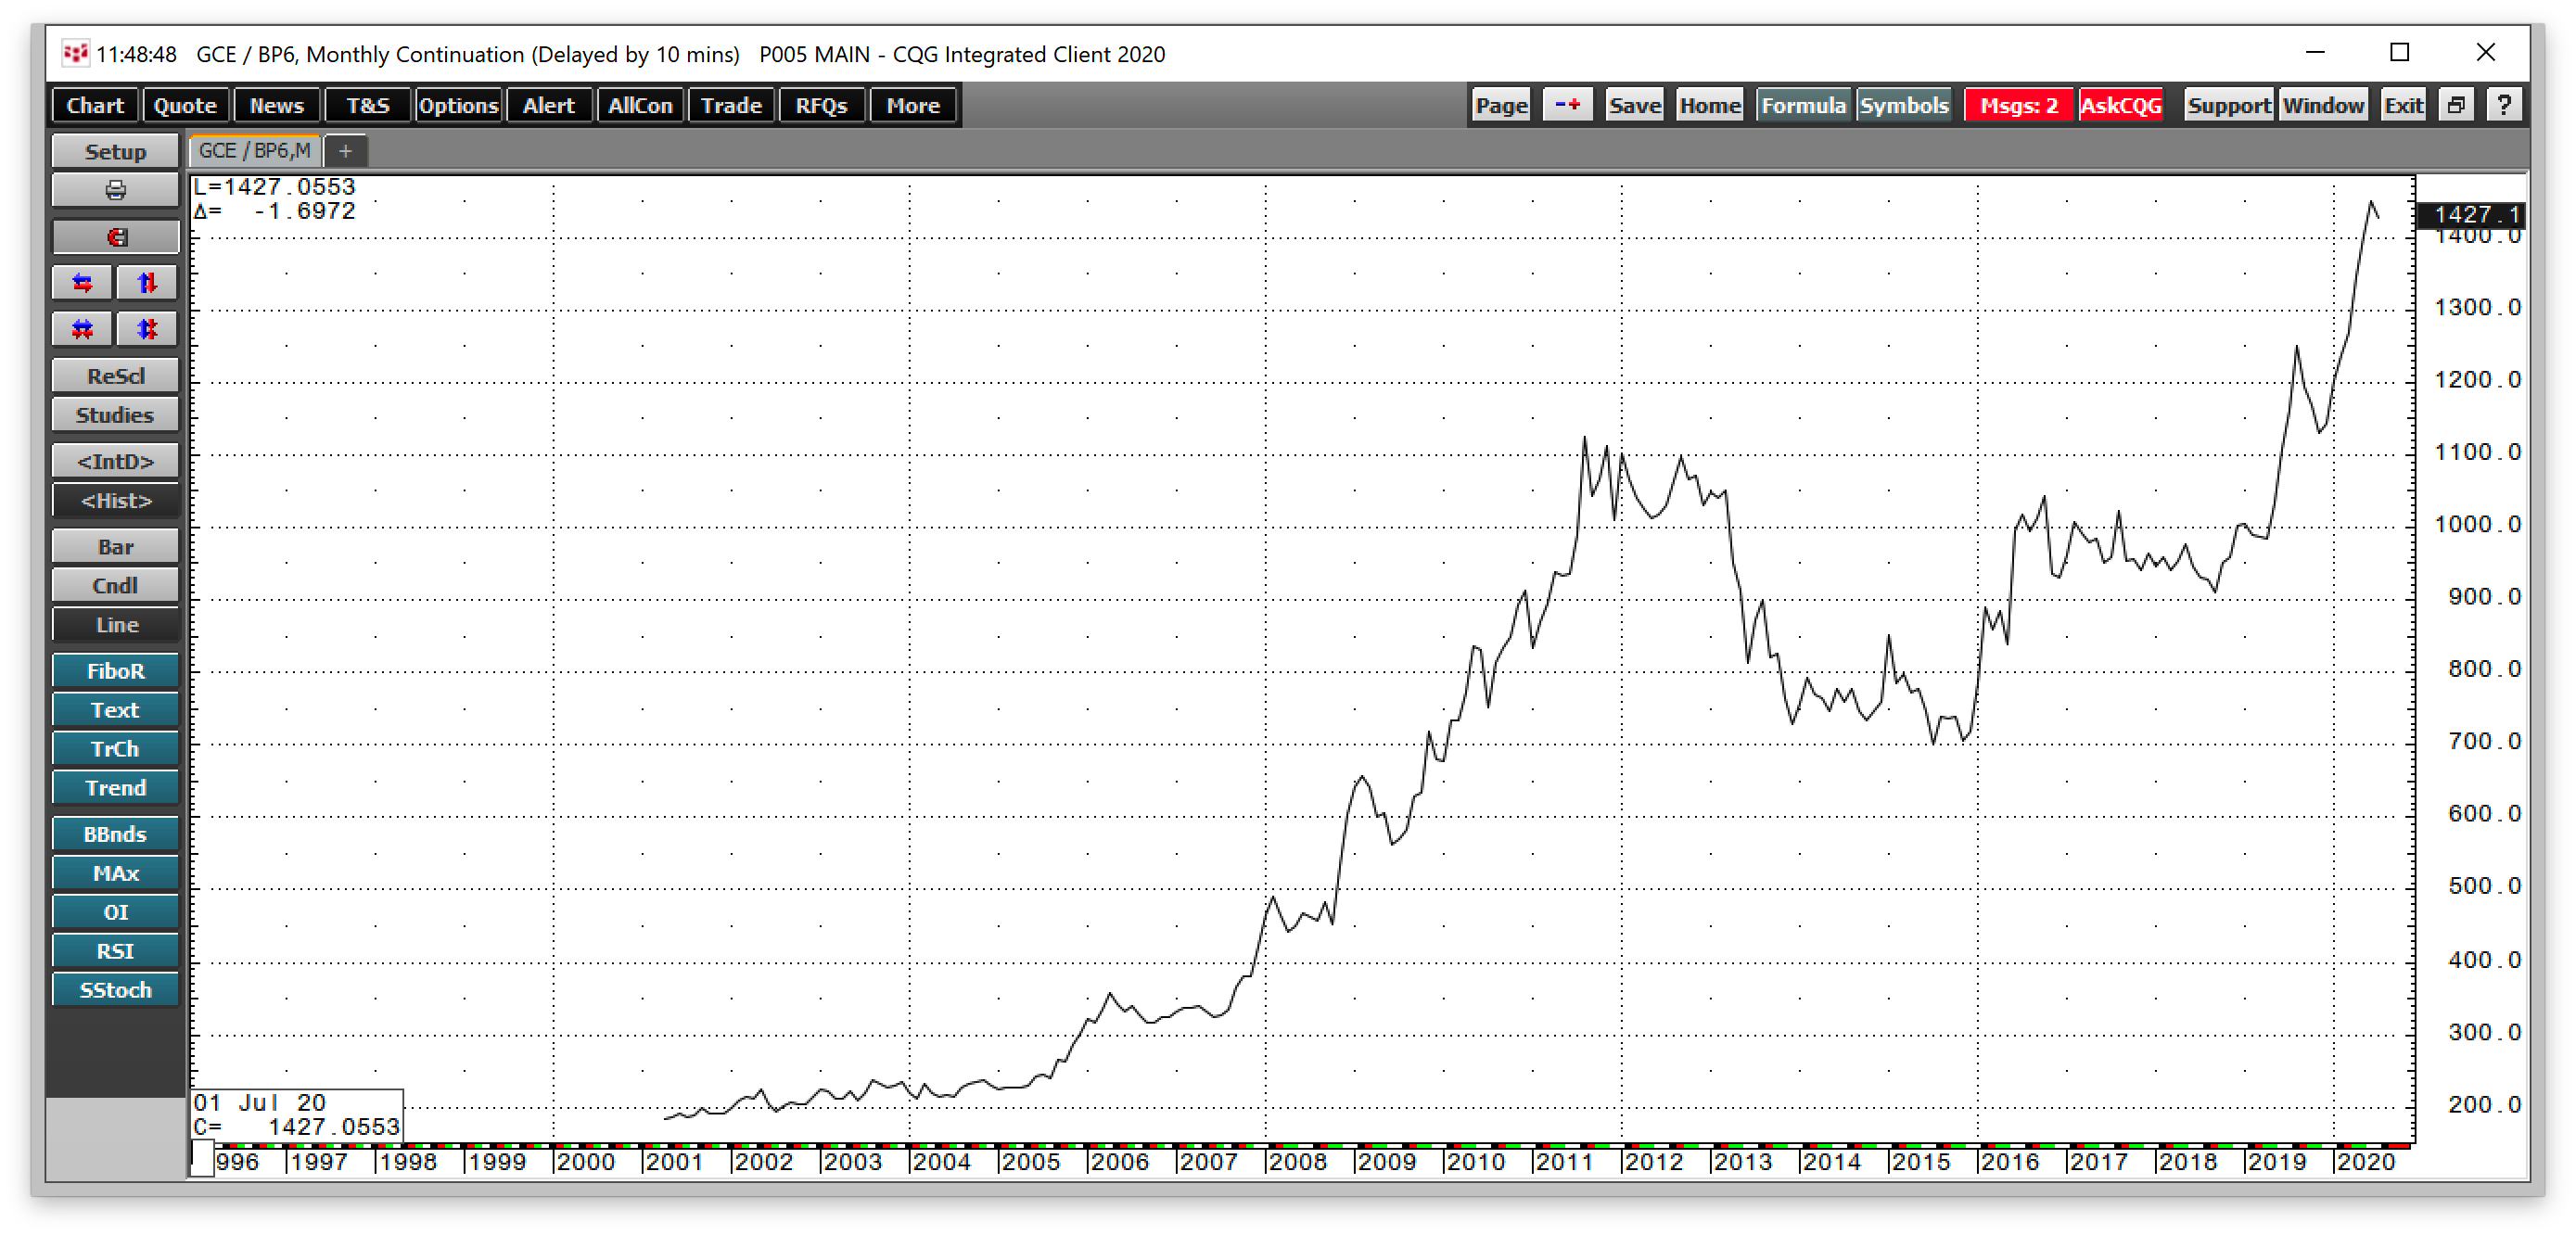
Gold in British pounds climbed above its 2011 peak at £1124 in July 2019 and rose to almost the £1450 pounds per ounce level recently.
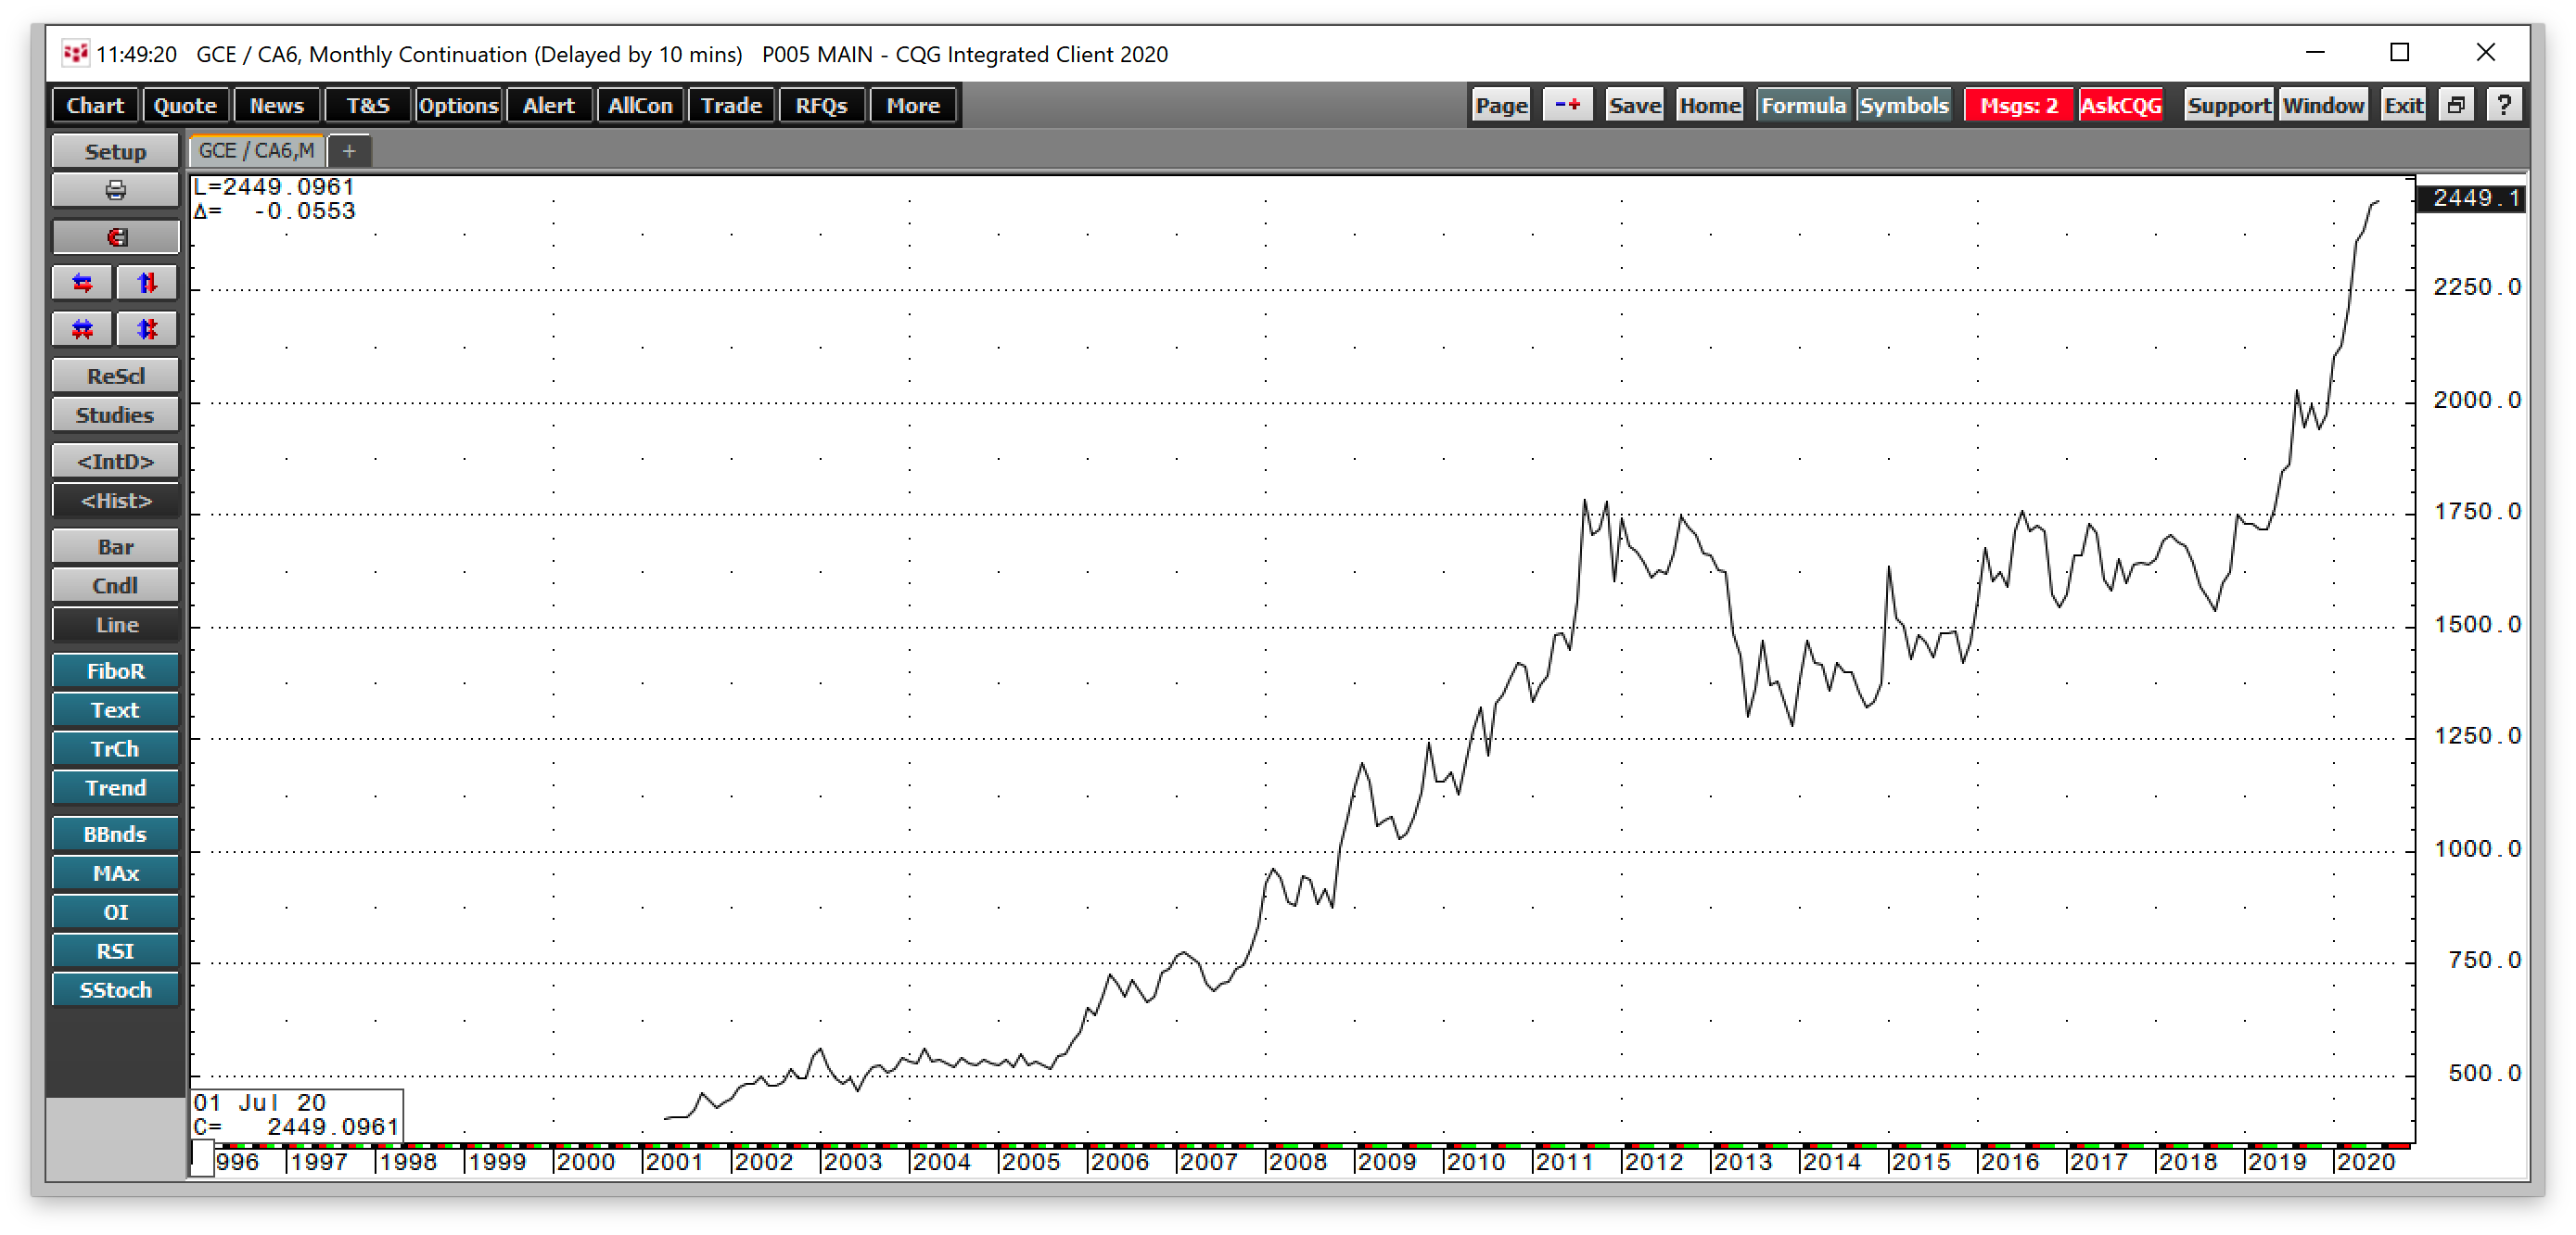
In the Canadian dollar, the previous high at CAD$1786 from 2011 gave way in June 2019 and was at the CAD$2450 level last week.
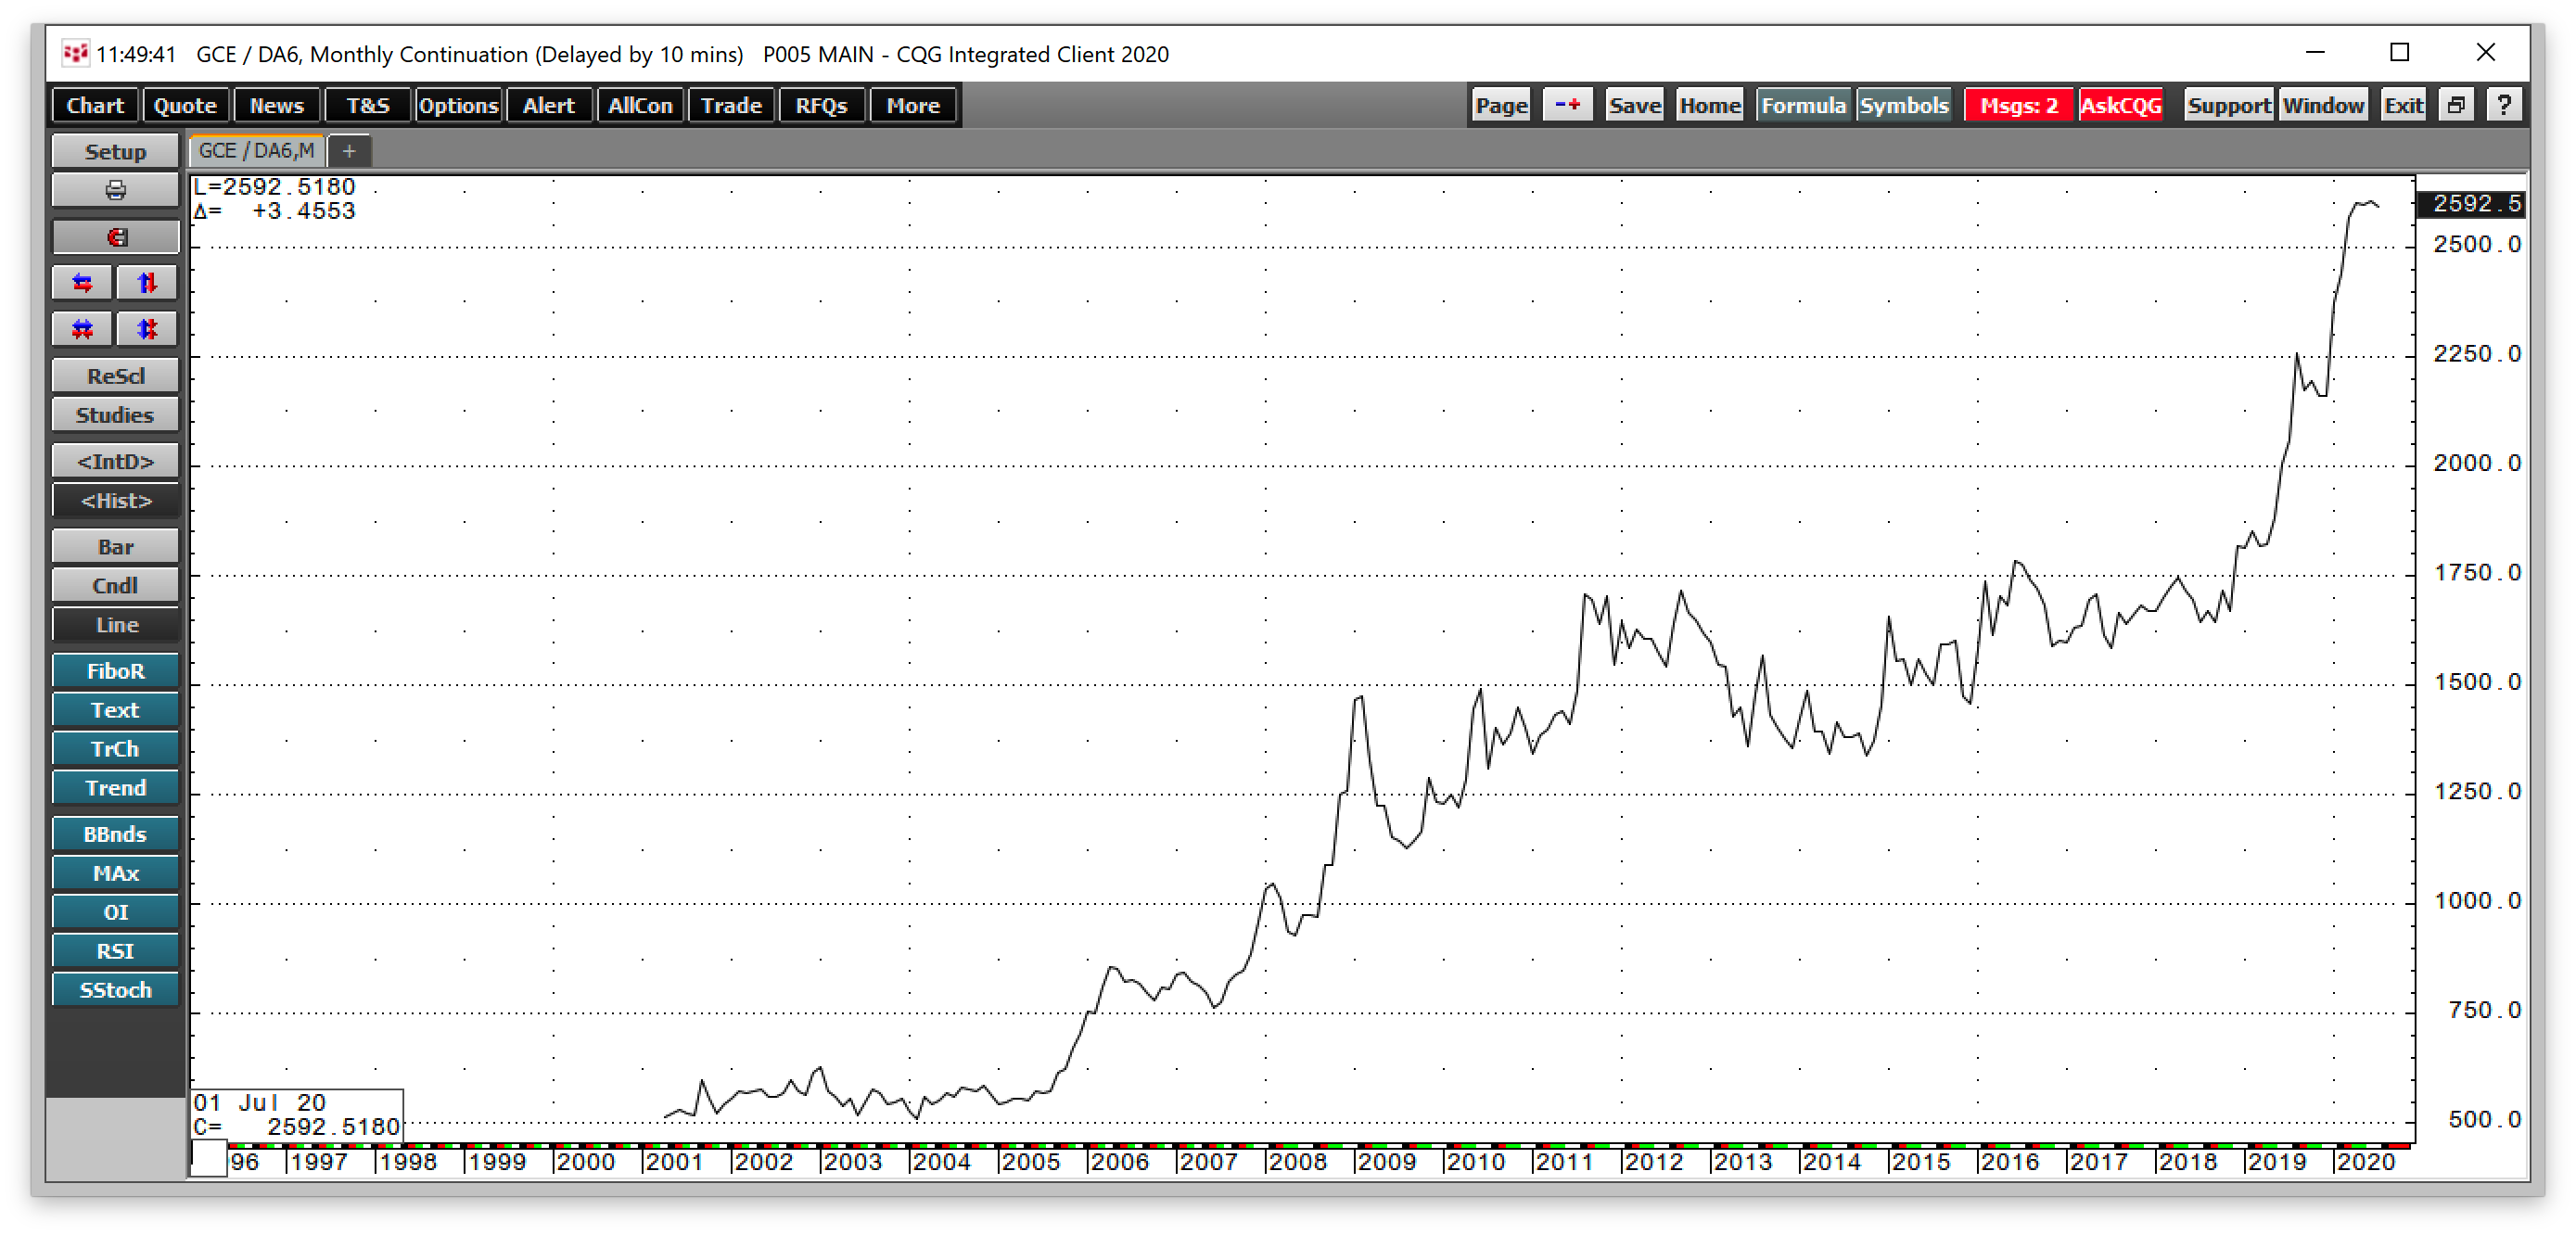
In Australian dollars, gold has been making higher lows and higher highs throughout this century, leading to the latest peak at over the AUD$2590 level.
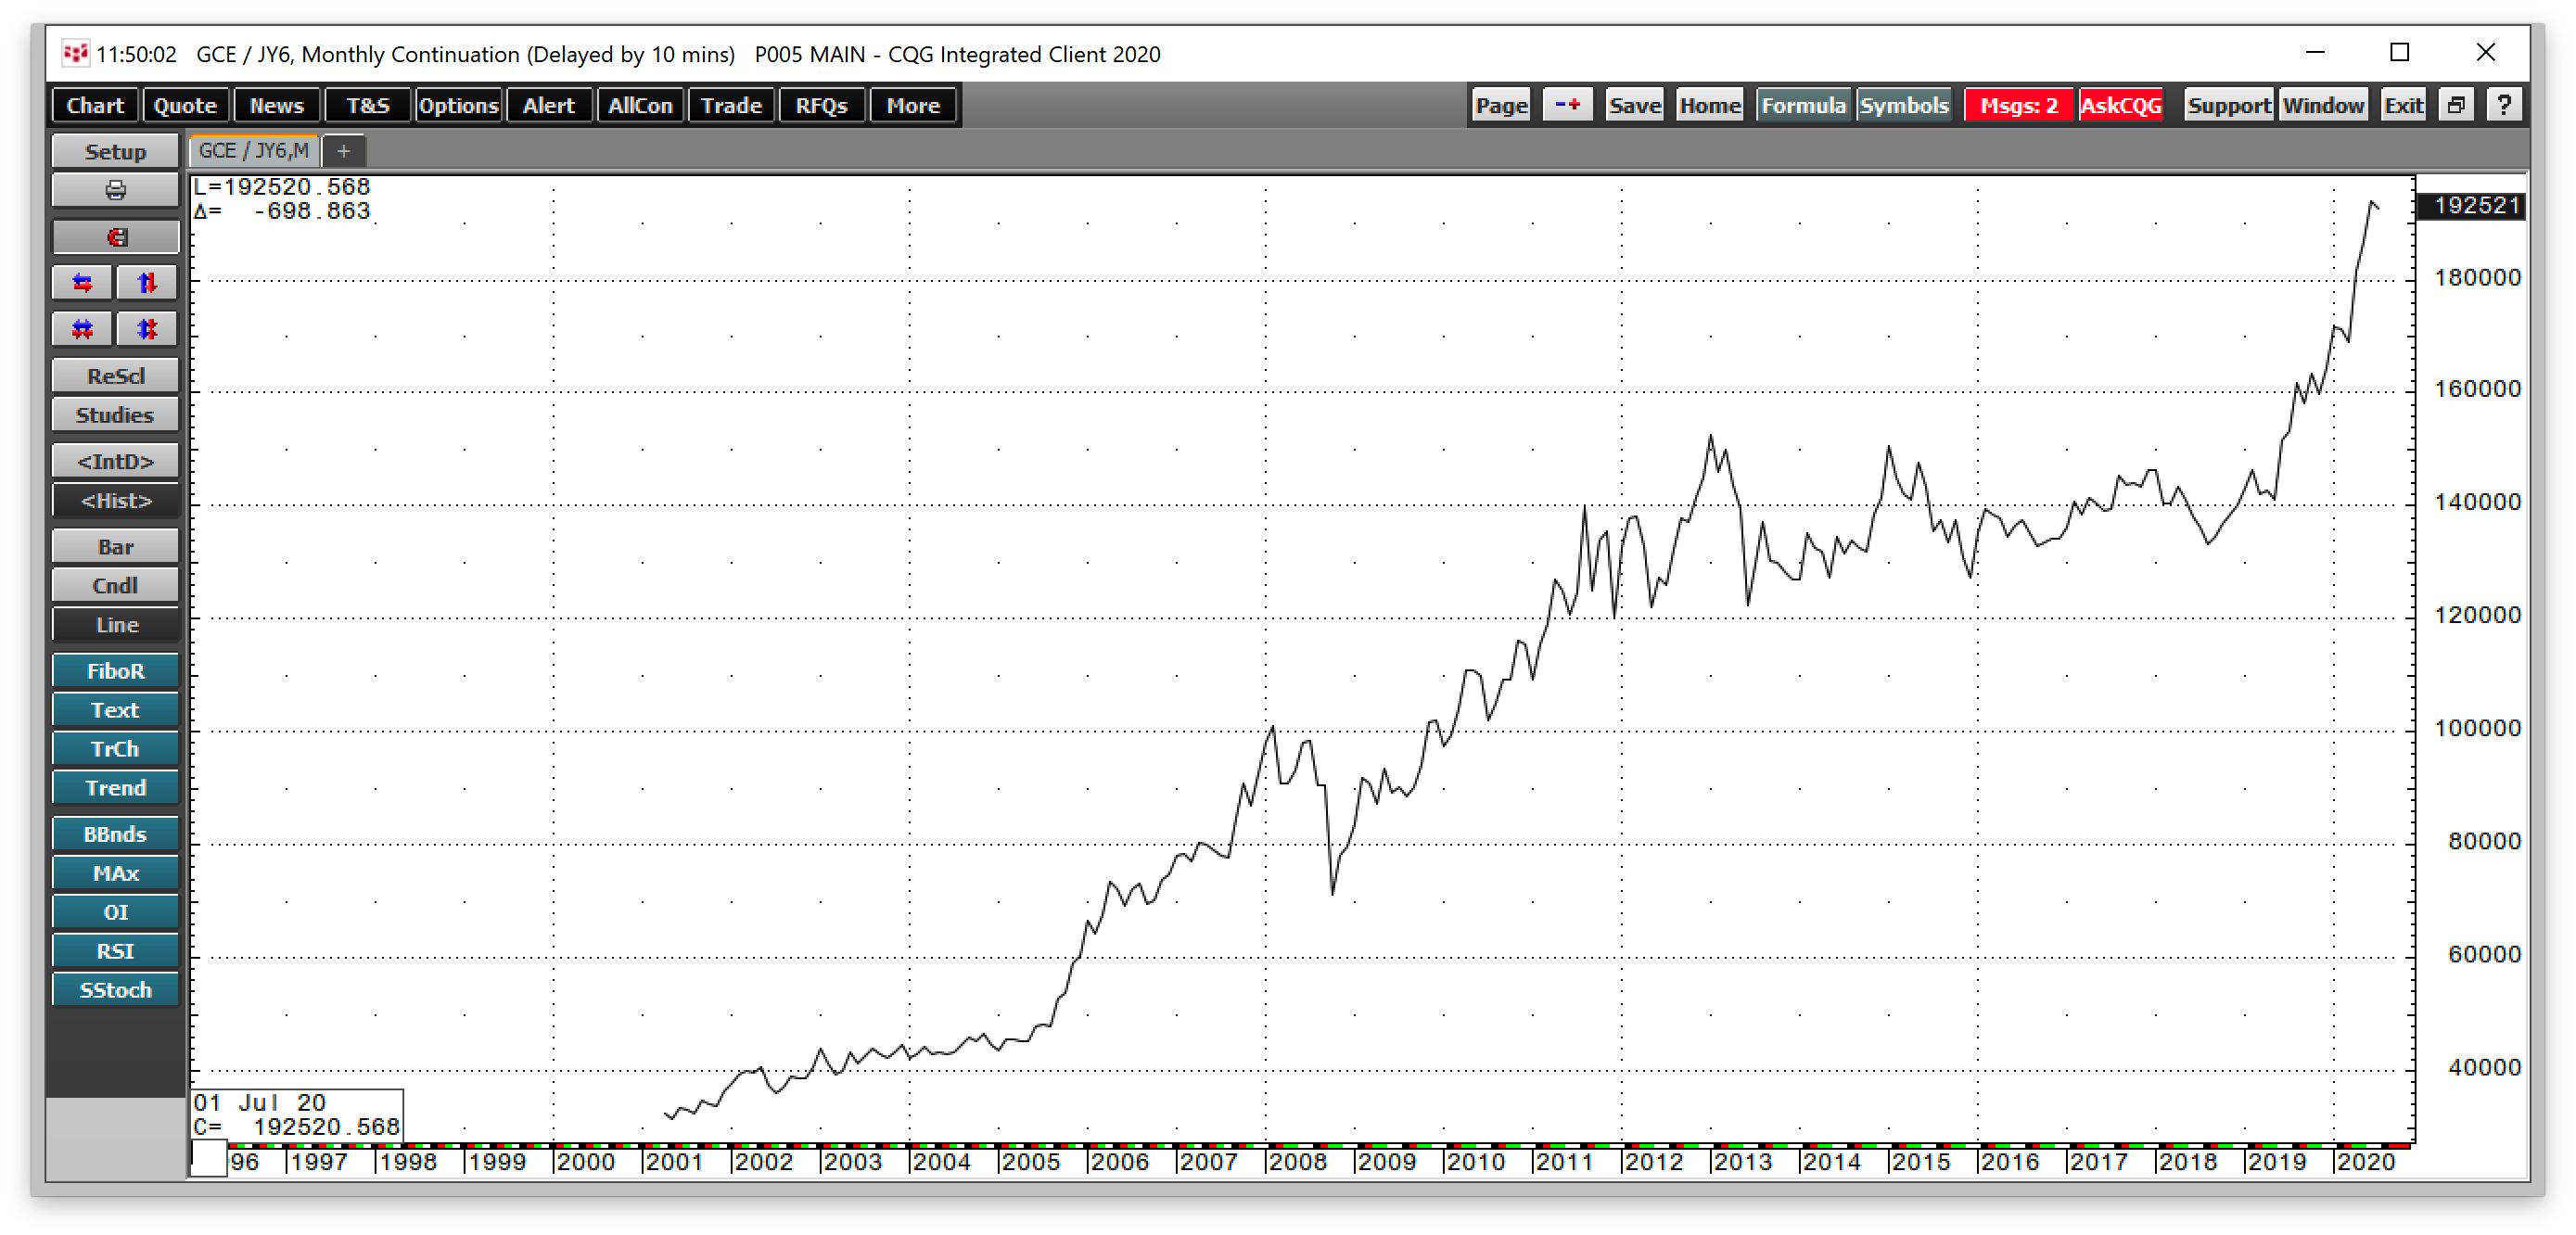
In Japanese yen, gold rose above the 2013 high at ¥152,457 yen per ounce in August 2019 and was at over ¥192,500 last week. Gold also rallied to new highs in most other currencies in 2019, including the Chinese yuan, Russian ruble, and most other foreign exchange instruments.
Gold’s new high marked fresh lows for the currencies against the yellow metal. The price action in gold has been a sign of the deterioration in the value of fiat currencies.
The Swiss franc was the last shoe to drop
The price of gold in Swiss francs waited until 2020 to make a new high.
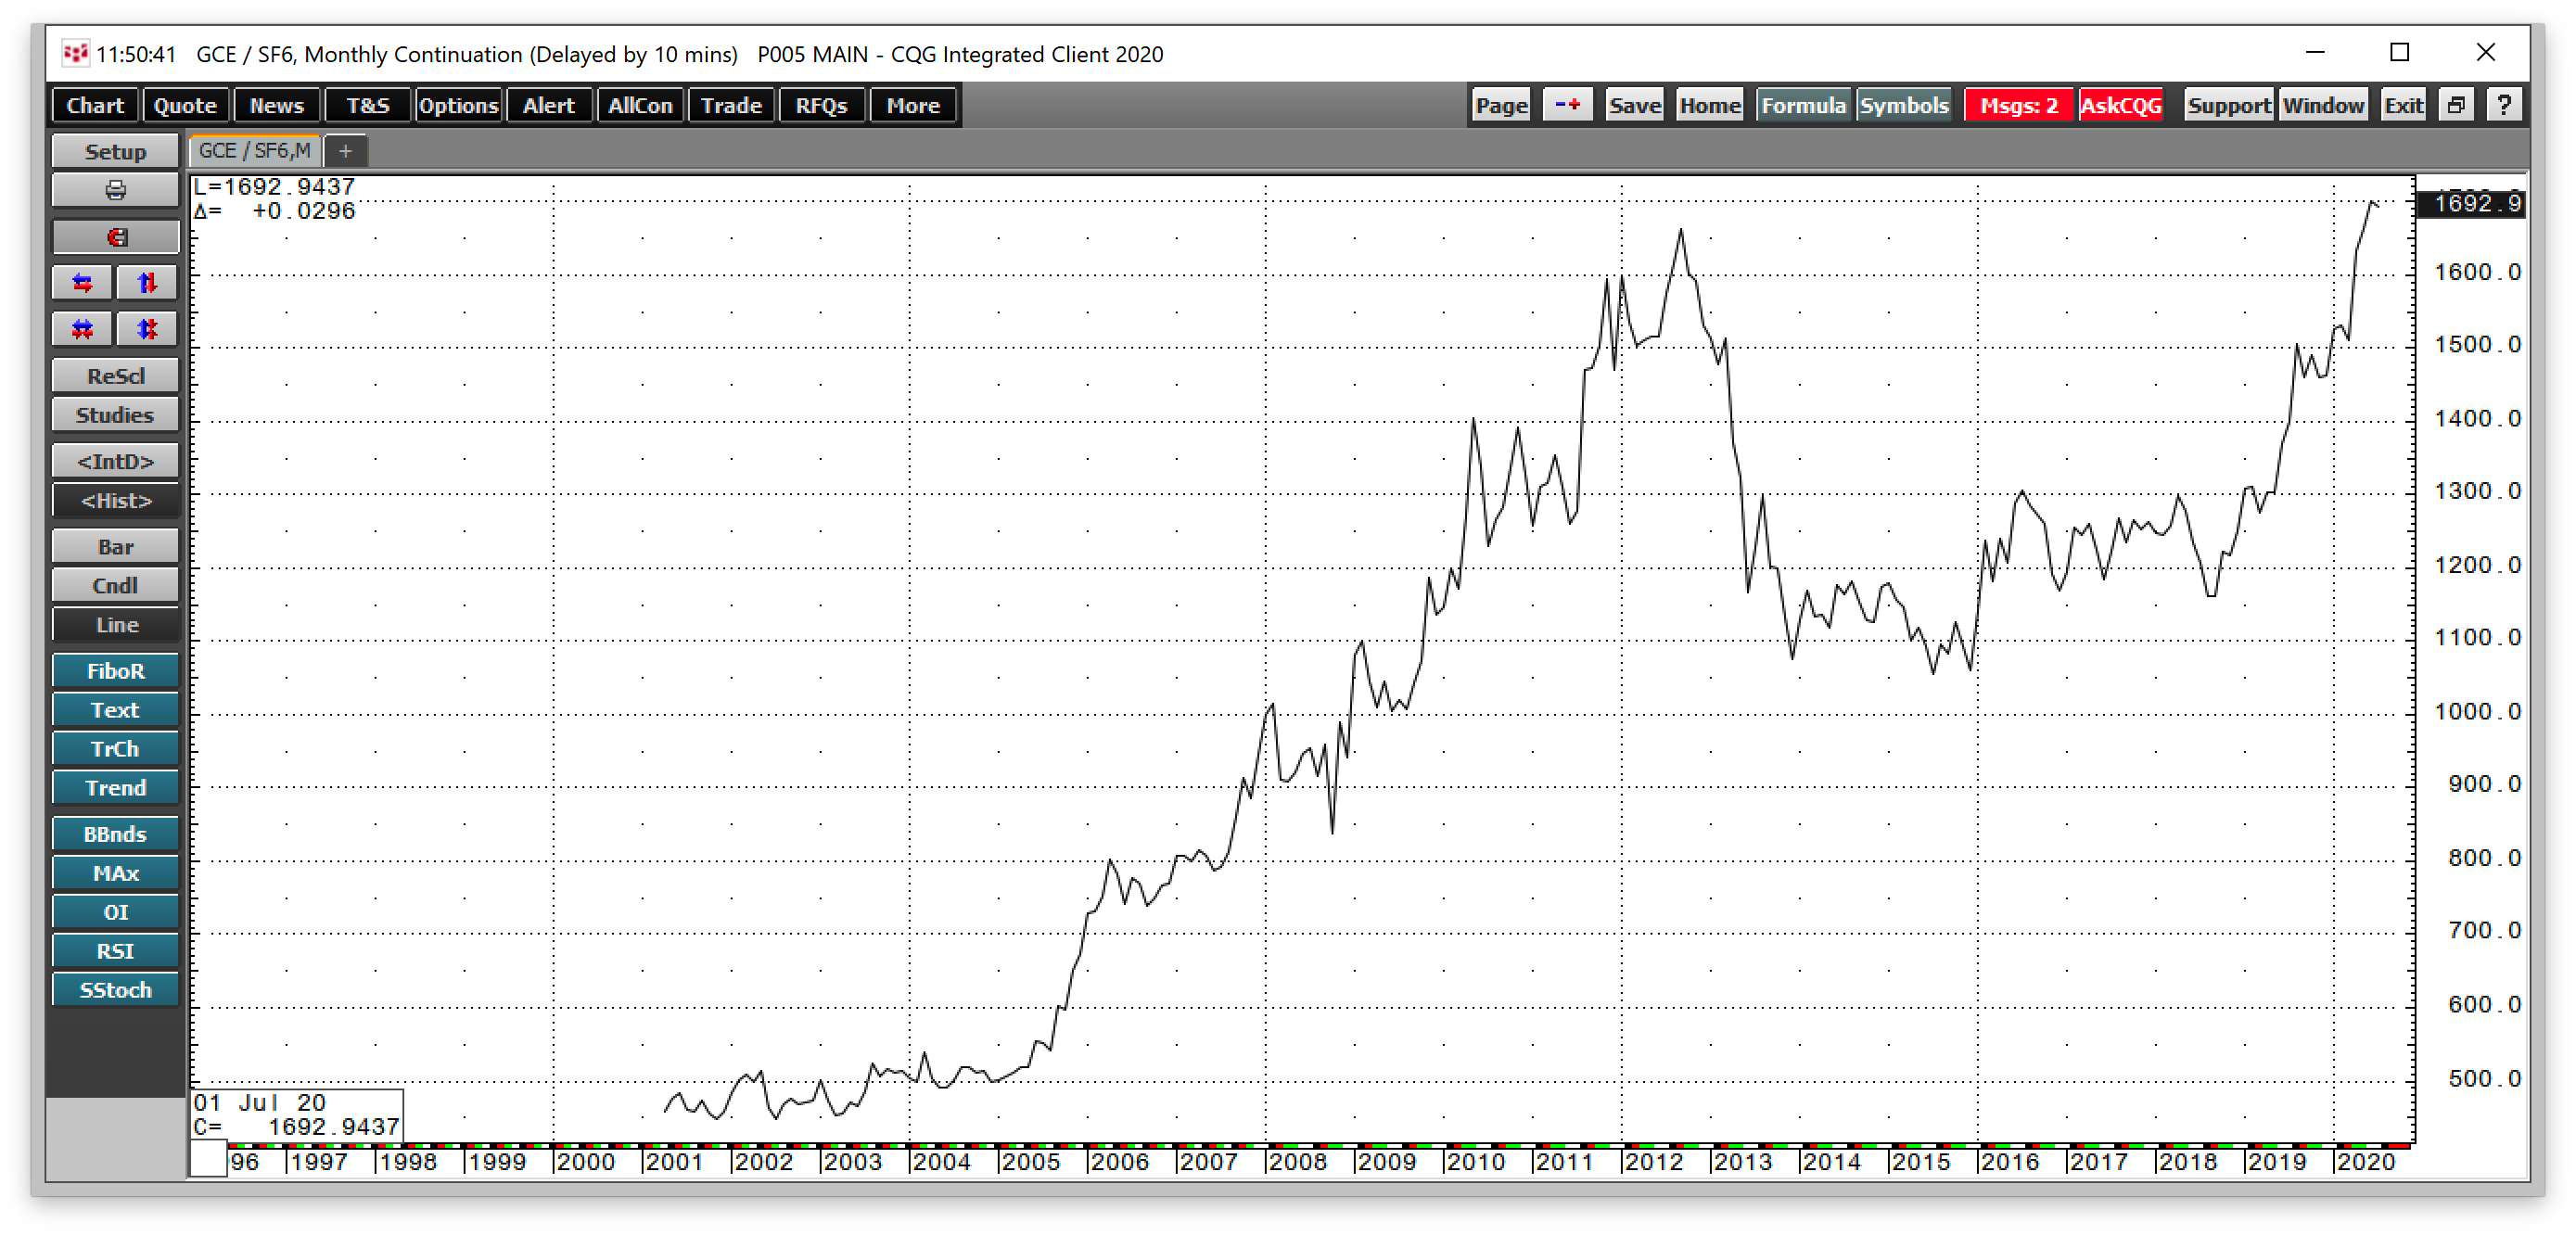
The chart above shows that gold in francs peaked at 1662.50 in 2012. In May 2020, the price rose above that level and was at around the 1700 level recently.
Gold heading for a test of 2011 highs in US dollar terms
The USD is the last currency standing that has yet to fall to a new low against gold. Though the dollar is the world’s reserve currency, the price action tells us that it is only a matter of time before the greenback declines to a new low against the precious metal that is also one of the world’s oldest means of exchange.
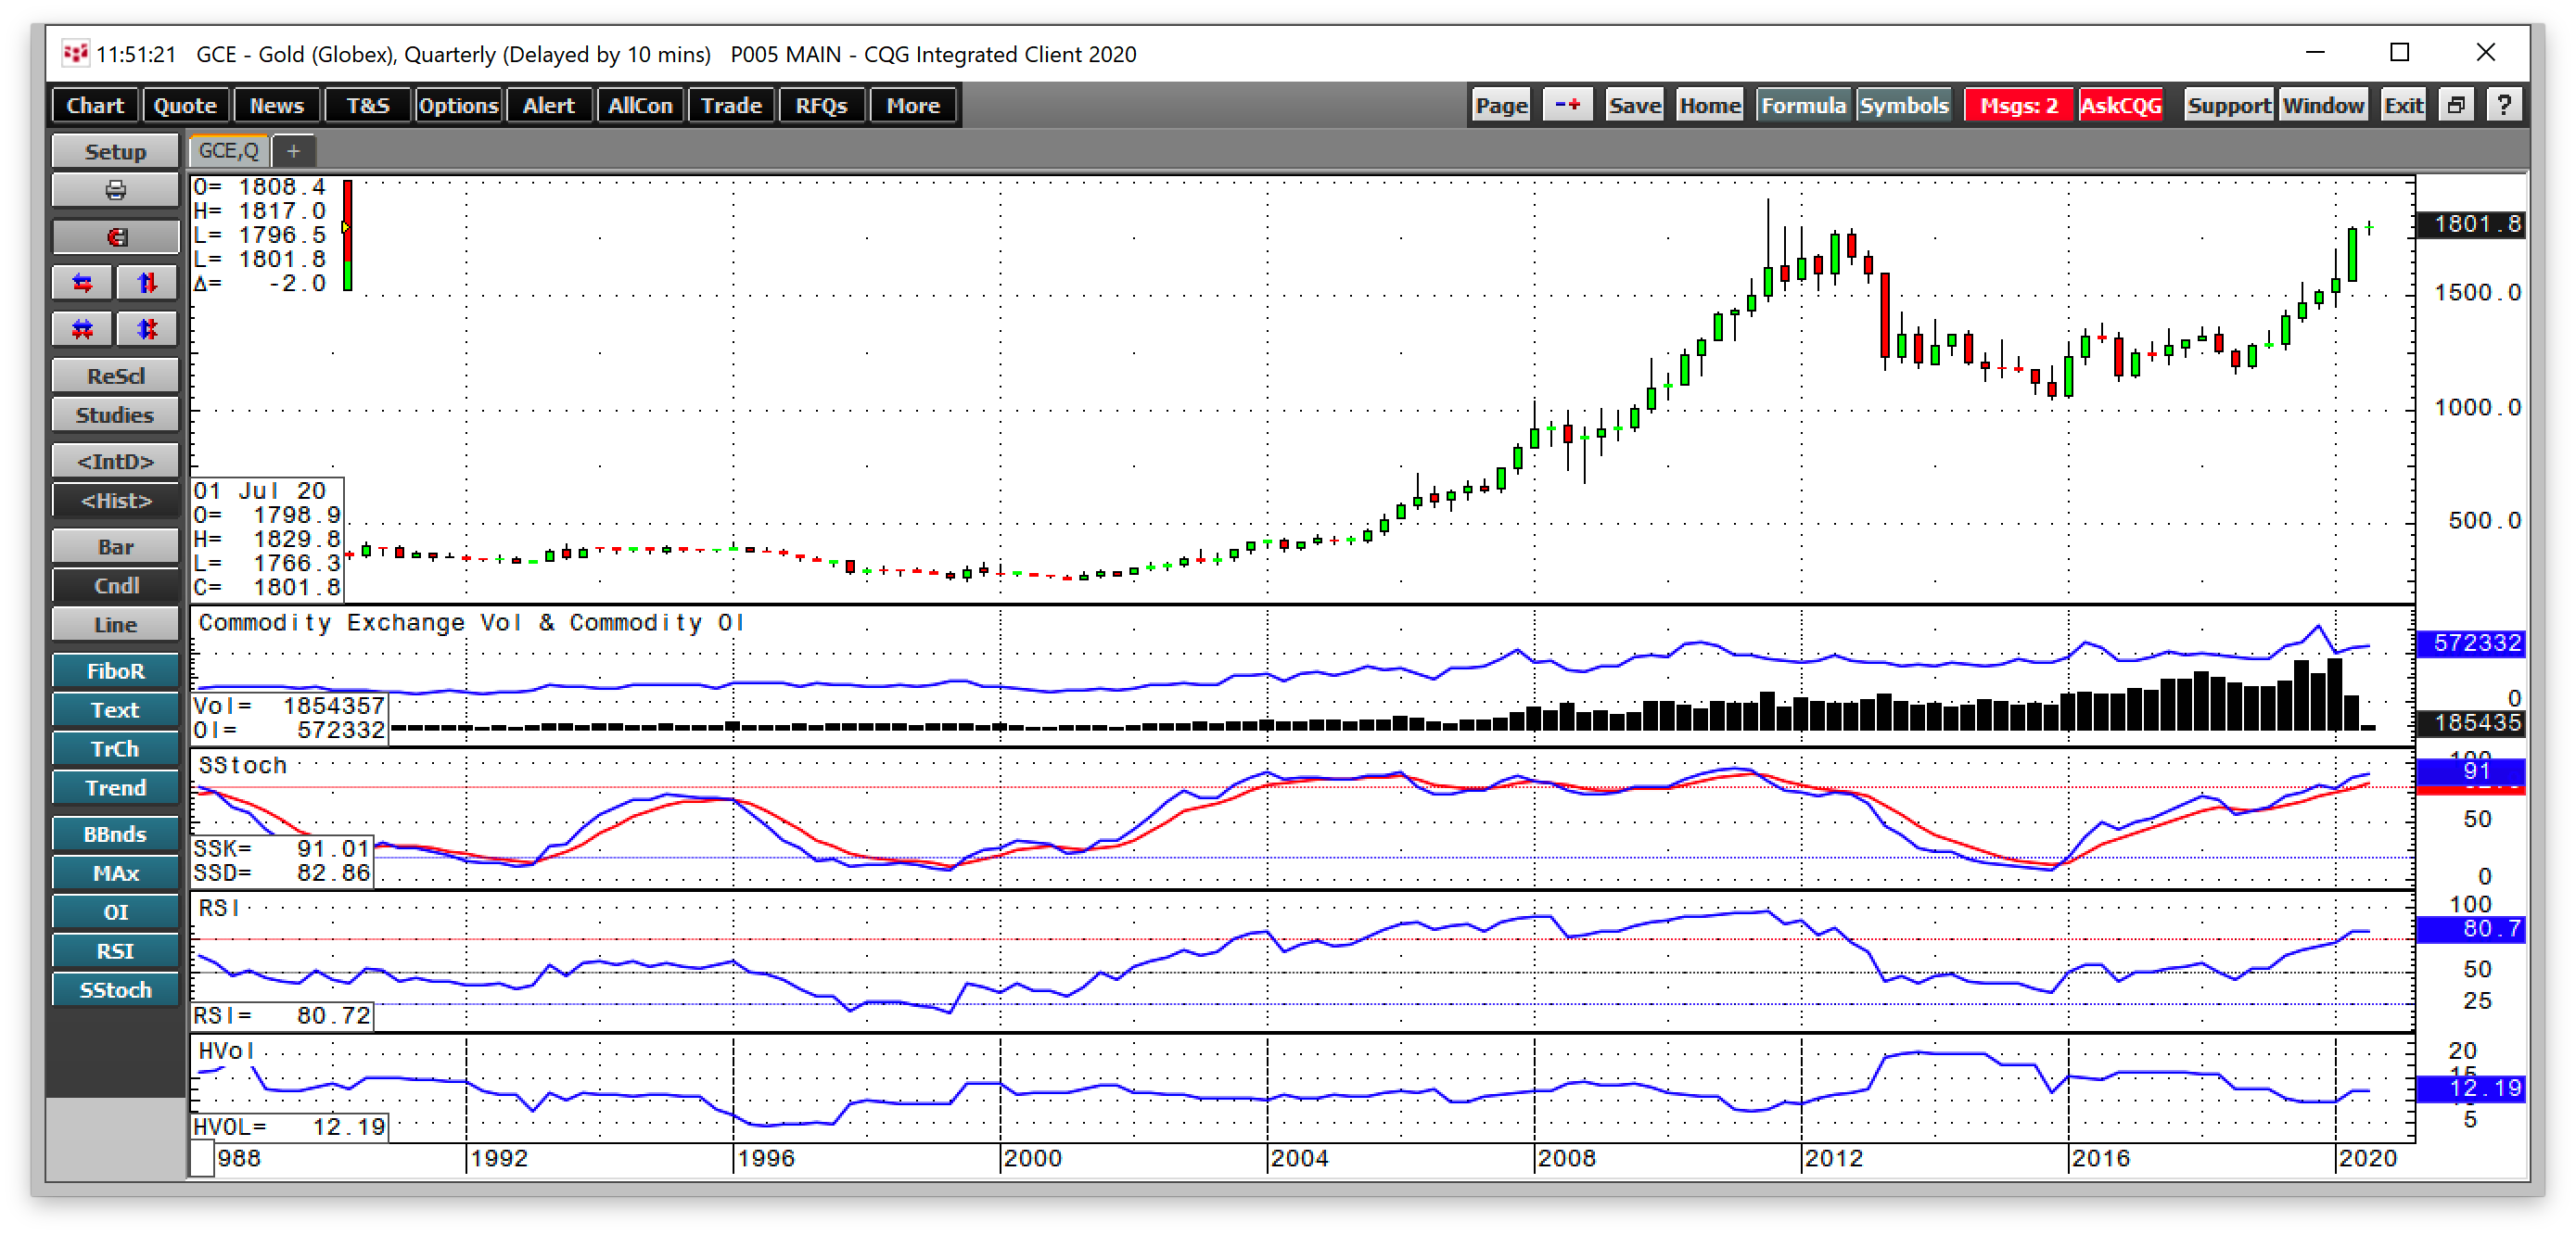
The quarterly chart of gold in US dollar terms, above, highlights that the yellow metal has moved above all technical resistance levels, clearing the path of a test of the 2011 high at $1920.70 per ounce. The most recent peak, at just under $1830, came last week.
Open interest, the total number of open long and short positions in the COMEX futures market has been rising along with the price. In a futures market, rising price and increasing open interest tend to be a technical validation of a bullish trend.
While price momentum and relative strength indicators have been in overbought territory on the quarterly chart since 2019, they can remain in an overbought condition for an extended period. From 2003 through 2012 the metrics displayed overbought readings.
Gold has posted gains over the past eight quarters as of July 10, from 2008 through 2011; the gold futures market posted gains in eleven consecutive quarters.
Finally, quarterly historical volatility at 12.19% as of the end of last week reflects a market taking the stairs higher without any parabolic moves, yet.
The potential for much higher levels is on the horizon
When gold rises above its high from 2011 at $1920.70, the potential for a rush of buyers into the market will increase. Citigroup analysts projected that gold would rise to the $2000 per ounce level before the global pandemic and the tidal wave of liquidity from central banks and governments that followed. Bank of America projected that the price would rise to $3000 per ounce.
It is more than a challenge to pick a top in any market.
The most significant factor in the gold market as the price approaches a new record level in US dollars is that it is appreciating in all currency terms. The ascent of gold is a commentary on the value of fiat currencies that derive their values from the full faith and credit of the countries that issue legal tender.
The bottom line is that gold is telling us that faith is declining, and credit is deteriorating. The price tag for unprecedented levels of stimulus is unfolding in the gold market. The target on the upside could be far higher than most analysts and market participants believe possible.
