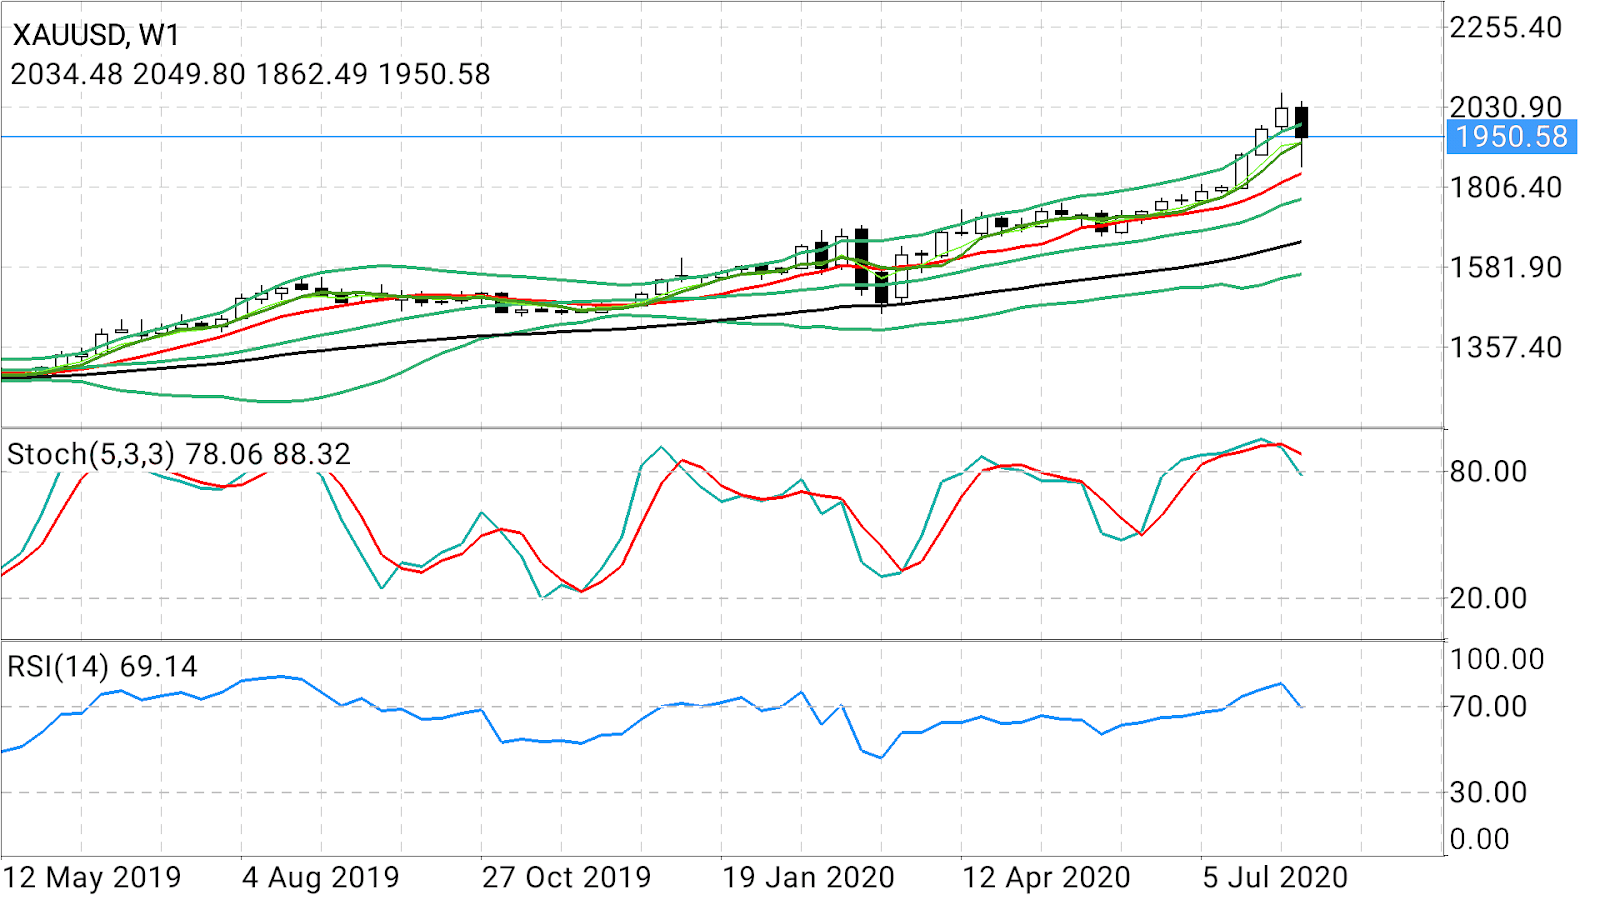
Back in June, even the naysayers would have privately admitted that they expected gold to hit $2,000 an ounce at some point this year, if not next. What even the bulls didn’t anticipate was it getting there in just a month. That amazing outperformance has now become gold’s bane.
As the yellow metal tries to claw back the losses of this week, that took it down $67 between Wednesday and Thursday—after an earlier meltdown of $93 during the “Black Tuesday” slump of last week—the argument being used against gold is that it had rallied too much, too fast.
Bears point to a metal that had picked up $630, or 43%, from March 16 lows of $1,459 to reach as high as $2,089 on Aug 7. For a more recent example, they cite the jump from $1,939 on Aug. 13 to nearly $2,025 on Aug. 18.
Those who are long gold, meanwhile, say its stupendous rally is based on valuation and inflation growth projected from trillions of dollars of U.S. and other national spending to fight the coronavirus pandemic. They argue that the massive U.S. debt creation, especially, and dollar debasement in coming years more than justify $2,000 gold or the near-term target of $2,300 many have. More ambitious targets begin at $3,000 and work their way to $5,000, though not even the most ardent bull is expecting such pricing anytime soon.
The most pertinent debate on gold now is what it’ll take for it to regain its $2,000 perch and, alternatively, what could extend the pain of its bulls.
Gold Needs Upside Strength On Charts
The answer to the first question—what’s needed for the clawback—is fairly simple: upside strength on the charts.
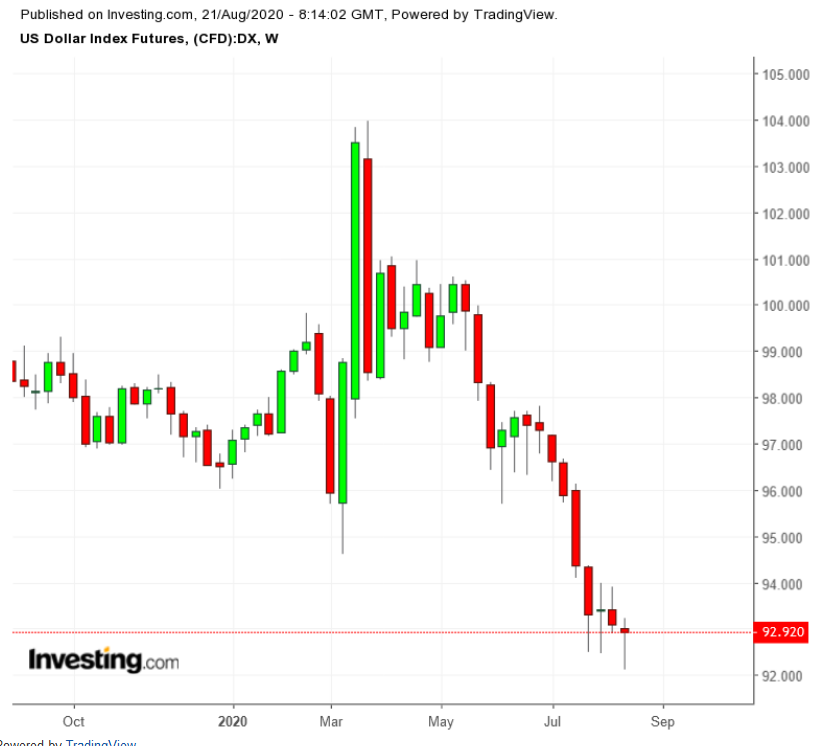
The second point—what could trigger more downside—is a little more complicated. Gold bulls are being frustrated by the sudden resurgence in U.S. Treasury yields, which until two weeks ago seemed doomed to sink deeper into negative territory, and a rebound in the dollar, which seems to have taken an inexplicable life of its own.
Let’s take a look first at the required upside for gold.
Investing.com’s technicals show that the spot price of gold, which reflects trades in bullion, needs to at least get to around $1,970 and hold to that level to move higher.
From there, the challenge will be making the pre-$2,000 leap to $1,990.
Sunil Kumar Dixit, an independent chartist on gold, concurs with our views.
“More precisely, the market needs conviction that the spot price can hold above $1,968. This is the very first condition for a sustainable rebound,” says Dixit. “Next sits the resistance at $,1990, the concurrence of descending trendline on the chart.”

Chart courtesy: Sunil Kumar Dixit
Pablo Piovano at FX Street also believes that gold looks to regain $2,000/oz. In a note written during Friday's afternoon session of gold trade in Asia Piovano wrote:
“The ounce troy of gold is slowly recovering the ground lost in the wake of Wednesday’s sharp pullback,”
“Thursday’s uptick in combination with rising open interest favours extra gains in the short-term horizon, always with the next target at the key $2,000 mark,” he added.
Downside Risks As Real As $2,000 Target
But there are dangers too that gold prices may fall short of the $2,000 target and open a sharper break lower than seen thus far this week.
“Caution is warranted as to how traders will react to the metal reaching $1,968,” Dixit said.
“If it presses on to $1,990, buyers may look for a high of $2,008 next. But failure to hold at this level can push the price back to $1,924-$1,900.”
Could gold go even lower? Investing.com data shows a potential test of $1,864—the low hit by spot gold right after the Aug. 12, Black Tuesday, selloff.
“If it tests $1,860 and bounces back to cross $2,000 and enters the bullish channel, a double-bottom can be established,” says Dixit, confirming the thesis in Investing.com data. “This potential formation will have the height of about $150, which if added to this week’s reach of $2000-2020, gives us the much anticipated $2,150 and beyond.”
Michael Boutrous at Daily FX has a similar view. "The gold breakout remains vulnerable on the back of this stretch—from a trading standpoint, be on the lookout for downside exhaustion,” he said in a Friday post.
“Above $1,795, (the) price is indeed heading higher with a topside breach above $2,033 needed to mark resumption. Subsequent topside resistance objective at 2105 and 2179.”
Now, let’s examine the down-drivers of gold: U.S. Treasury yields and the Dollar Index.

Interestingly, extreme short positions held on both by traders until recently were what gave gold its original 30% price gain for this year, taking the shiny metal beyond $2,000. Their turn-around since has become the antithesis to gold’s rally.
Treasuries, Dollar Rally Have No Staying Power
According to the forex industry grapevine, the benchmark 10-year U.S. Treasury note’s snapback this week was sparked by the Federal Reserve’s unwillingness to set a control on the yield curve of bonds. The Fed made its decision known in the minutes of its July meeting released Wednesday—which became the catalyst for the twin rallies in yields and the dollar and spelled doom for gold.
“Many participants judged that yield caps and targets were not warranted in the current environment,” the minutes concluded, citing the costs and risks associated with such practice, aside from the difficulty of micro-managing the controls in day-to-day operations.
Aside from that teeny fact against yield caps and targets, the Fed all but issued a damning indictment on U.S. economic recovery from the coronavirus pandemic. The central bank also reaffirmed its intent to keep interest rates at near-zero and virtually print as much as money as necessary through its limitless balance sheet to help the United States see off the virus. These factors, under ordinary circumstances, should have seen gold flying higher in the $2,000 territory.
Yet, traders chose to do the opposite, sending yields on the 10-year note up 2% on Wednesday. The Dollar Index—which has absolutely nothing positive in the near-term going for the currency—rose by an amusing full point to reach above 93 on Wednesday. It has clambered lower since but remained stubbornly above 92.65 in Friday’s Asian trade despite weekly U.S. jobless claims coming in higher than expected.
Japan and European macroeconomic data have also been better than U.S. stats over the past 24 hours, making the euro and yen better bets against the dollar. Yet, the greenback’s inexplicable strength continues. Could it be that the traders keeping the dollar artificially propped expect Fed Chair Jay Powell to call them the next time he makes a decision on Treasury caps or controls?
Powell is due to speak at the Fed’s all-important Jackson Hole annual retreat next, delivering his take on the Fed’s Monetary Policy Framework Review, between next Thursday and Friday. Perhaps that’s what’s needed to bring dollar bulls back to their senses.
Disclaimer: Barani Krishnan does not hold a position in the commodities or securities he writes about.
