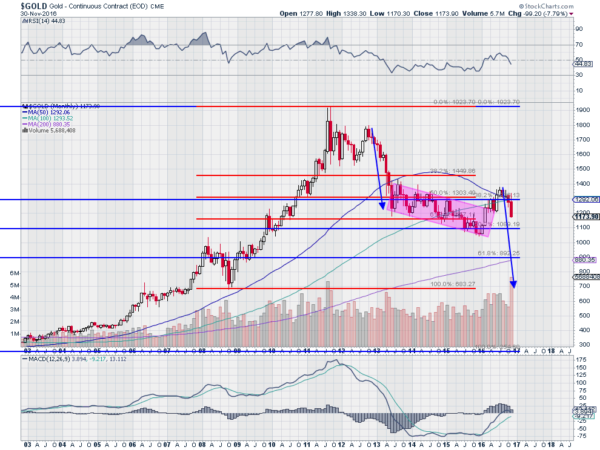
Gold had a horrible month in November, falling nearly 8%. In fact all of that drop happened after the US election, so it was a really bad 3 weeks. It enters December at levels not seen since February. That sounds a lot less severe. But the picture is not one for complacency, nor a place to look for a buying opportunity. Gold could be on the verge of a major move lower.
The chart below tells the story. After a 10-year move to the upside it made a sharp top in 2011. Eighteen months of consolidation were then followed by a sharp move lower from November 2012 through June 2013. Over that 7 months, gold retraced nearly 61.8% of the move from the 2008 low to the all-time top -- just over 38.2% of the full move higher. These Fibonacci ratios are key levels for traders and you can see they mattered again as the shiny metal stopped falling.
Gold settled into a consolidation zone, which turned into a falling channel for the next 3 years. At the start of 2016, gold pulled back 50% of the full move to the top and was bought with fervor over the next 3 months. The buying petered out as it retouched another confluence of Fibonacci ratios at a price of $1300. And then came November, with a sharp move lower, a near Marubozu candle, finishing the month at its low.
From its current position, there are many factors that point for a continued move lower. The RSI at the top of the chart measures strength of momentum and it shows a stall when gold hit $1300 at a reading that could not make it into the bullish range. Now that RSI is accelerating in the bearish range. The MACD at the bottom, another momentum indicator, stalled as it poked into positive territory and is now reversing. It would give its own sell signal on a cross down through the signal line. Many traders use moving averages as a guide and for gold, that's bad news. The advance early in the year stalled as it hit is 50-month SMA. That moving average continues to push lower and the volume is picking up.
How Far Can It Drop?
A measured move focusing on the sharp decline in 2012 into 2013 would give a target to the downside of about $700. That would be a full retracement of the leg higher from the 2008 low to the top. It would also be a 78.6% retracement of the full move higher, another key Fibonacci ratio. The next major level below that would be at about $550, a 88.6% retracement. At that point, it would complete a bullish Bat harmonic pattern, and would likely attract buyers.
Of course gold could just reverse course in December or at any other point along the way. The technicals give price levels that will mean something to many traders if it gets to them, so they are important to know. So $700 or $550 is not a ‘target’ or a ‘call’.
For now, gold is weak and looks to get weaker in the near term.

