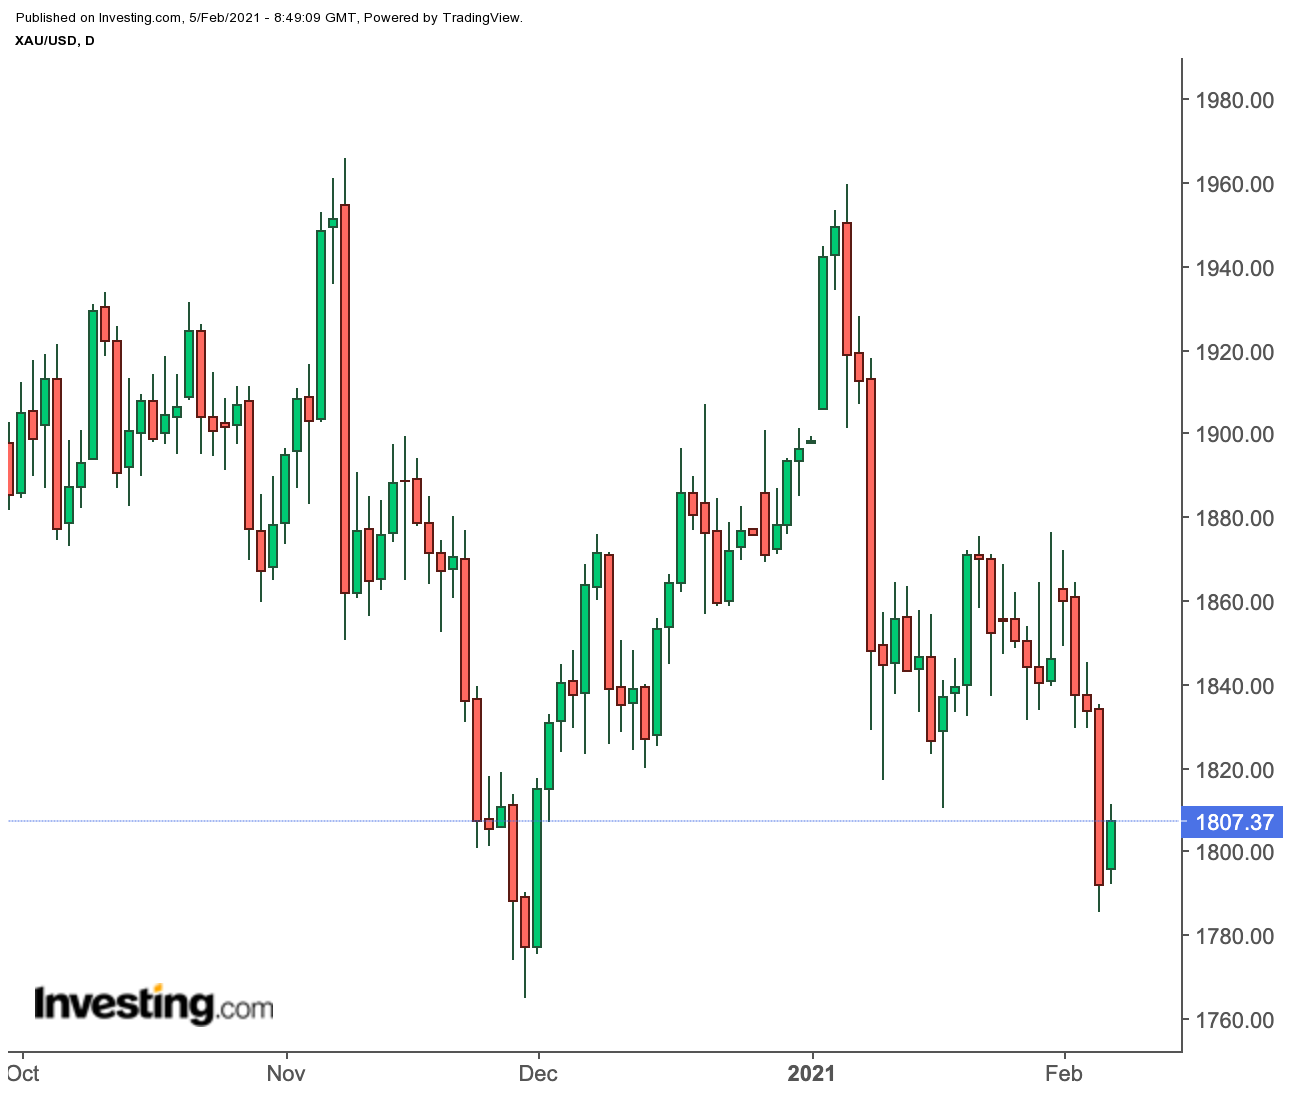
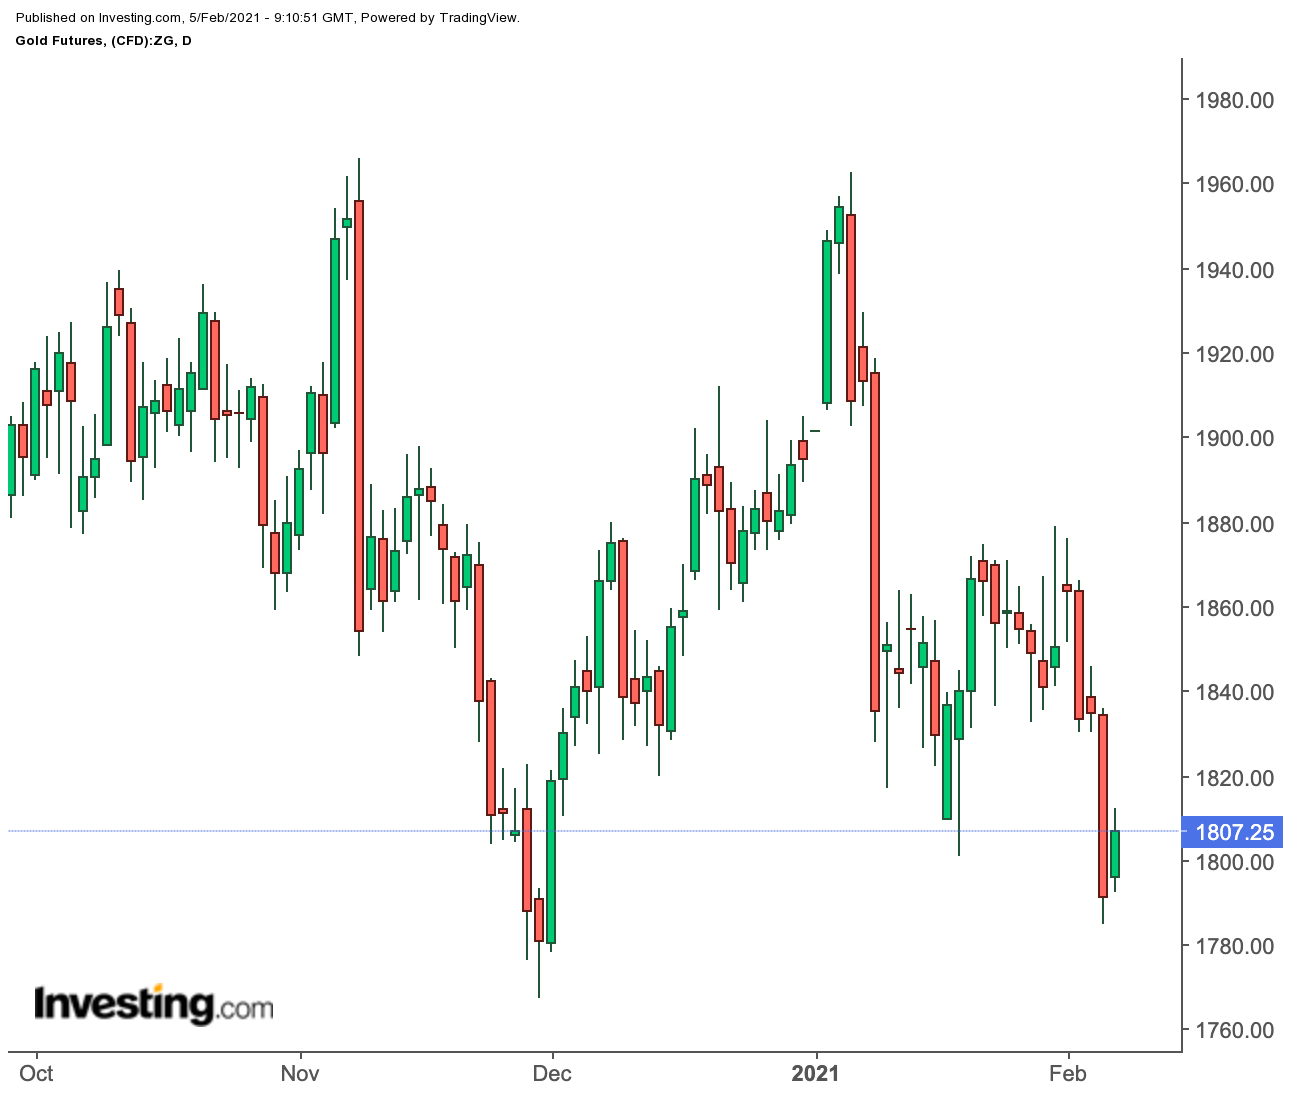
With a still-fragile US economy, worrying levels of COVID-19 infections and deaths, and blockbuster pandemic-related spending anticipated in coming months, gold's return to November lows of under $1,800 means its 'safe-haven' tag can be truly abandoned.

For decades, the yellow metal has been described not just as a hedge against inflation, but also protection against economic and political troubles. Owning gold felt good when fiat currencies showed their vulnerability during financial meltdowns. In times of conflict, one could gaze at commodity price screens and see the green bar soaring on the gold column.
These days, however, investors with exposure to gold ETFs and futures more often than not see red. What is soaring instead is the dollar and US Treasury yields. Both have been acting as though the United States is out of the woods where the pandemic is concerned.
For months now, gold prices haven’t truly reflected the risk factor to the US economy from the global spread of the UK and South African variants of the virus, and slower-than-anticipated vaccine rollouts.
Virtually Zero Regard For Geopolitical Risk
It’s the same thing where geopolitical risk is concerned.
True, the pandemic has whittled down international conflicts to almost zero over the past year, save for the November killing of Iranian nuclear scientist Mohsen Fakhrizadeh, that came just ten months after the even more high profile assassination of the Islamic Republic’s top general Qassem Soleimani.
Yet, a bomb could go off in the Middle East today and the price of gold may hardly go up. On the contrary, it might even fall. And some Wall Street analyst will find a ludicrous explanation to make sense of that and the market will be happy to buy it.
The point is this: in the near-term at least, the only thing investors in gold should be worried about are price charts that give cues on when to go long or short, and the stop losses to apply along the way. Similar relative value comparisons of dollar/yields will help their risk-reward pursuit.
Charts More Relevant Than Ever Now
For sure, reacting to the right technicals has always been rudimentary to gold trading. Only now they’re more relevant than ever, thanks to Wall Street’s narrative that has completely decimated the safe-haven proponent in gold.
Thursday’s dump of gold and surge in the dollar and yields came on the back of mildly encouraging US labor market data—i.e. a third straight drop in weekly jobless claims that brought the stats down by 10% over the period, while the actual number itself remained elevated at near 780,000.
The other data on the day that mattered: The Institute of Supply Management’s 58.7 point-reading in January that beat market expectations of 56.8 and December’s actual reading of 57.7. In terms of relevance, the ISM numbers pointed to the strongest growth in the services sector since February 2019.
While the dollar and the benchmark 10-year Treasury yield deserved a prop on that, the return on the two-year bond remained depressed at December lows.
Options that the Fed would change rates still assumed a small probability of further decline, completely excluding an increase until the end of the year.
The stock market took full advantage of the upbeat data, with the S&P 500 and NASDAQ racing to record highs.
Yet, with the Biden administration’s next major stimulus spending for the economy channeling its way toward Congress—either in its entirety of nearly $2 trillion or the sum of a few parts—there was little excuse for gold futures' loss of $44, or 2.4%, that took it to Thursday’s close of $1,791.20 on New York’s COMEX.
Also a recap of points I have made previously:
- At a 1.1% yield on the 10-year note, the annual servicing payment would amount to roughly $370 billion. Right now, US national debt is approaching $28 trillion, and total debt-to-GDP sits at a stunning 146%. The US federal budget deficit itself is already at $4.5 trillion or so, after adding the Trump administration’s $3 trillion plus COVID-19 stimulus for last year.
- If the 10-year note’s yield rate stands at 2%, coupled with a $30 trillion national debt, annual servicing payments would amount to $660 billion roughly. Annual deficits will continue to make the national debt stack even higher.
- And while the United States appears to be in the relatively early stages of a monetary expansion cycle, money supply could still increase substantially and set the country up for a return to the 2008/2009 financial crisis days. With the dilution of the fiat monetary system, higher inflation is most certainly on the way.
Indeed, there might be a chance for the US economy to rebound quicker this year than the Federal Reserve expects. If that is the case, then surely there is a chance for inflation to rise too. Historically, gold prices have had a very strong correlation over the long-term basis with monetary base expansion.
Yet, none of these seem to matter now, as gold bears are allowed to run riot over gold prices, with little support coming in at the higher levels from buyers who probably fear more outsized losses with such bullish exposure.
Just Stick To Technicals For Now
So, back to basics: What do the charts say?

On my end, Investing.com’s Daily Technical Outlook, unsurprisingly, has a “Strong Sell” on COMEX gold.
The three-stage Fibonacci support that I plotted shows first support at $1,784.31, second at $1,772.25 and third at $1,752.73.
Fibonacci resistance begins at $1,823.35 on my end, which might be a high point at this juncture.
Other analysts are equally bearish as Investing.com’s near-term model.
Says Christopher Lewis at FX Empire:
“Ultimately, the market looks as if it is going to try to reach down towards the $1,767 level. That was the scene of a major hammer that has turn things back around but ultimately, I believe that the support probably extends down to the $1,750 level. If we were to break down below there, then gold would be in serious trouble for a longer-term downward move.”
James Hyerczyk, another technical analyst who posts on that site, says:
“The selling could extend into $1,787.30 to $1,711.70 over the near-term as brokerage clients continue to liquidate their “safe-haven” buys and long positions placed in anticipation of a weaker US Dollar and massive amounts of fiscal and monetary stimulus.”
Jeffrey Halley of online broker OANDA, meanwhile, lends a touch of 1980s nostalgia, musicality and humor to his gold outlook, invoking Spandau Ballet’s hit from that era, aptly called, what else, but Gold:
“Gold may feel less Spandau Ballet, and more Spandau Prison in the short-term. Critical support remains the 50.0% Fibonacci of the March to August rally at $1760.00 an ounce. Failure sets up a capitulation trade into next week. Gold, something I should have learned, you're indestructible, but you will look even more indestructible when your price starts with a 15 or 16.”
Make a pick or follow your own chart.
Godspeed and a Happy Weekend.
Disclaimer: Barani Krishnan uses a range of views outside his own to bring diversity to his analysis of any market. He does not own or hold a position in the commodities or securities he writes about.
