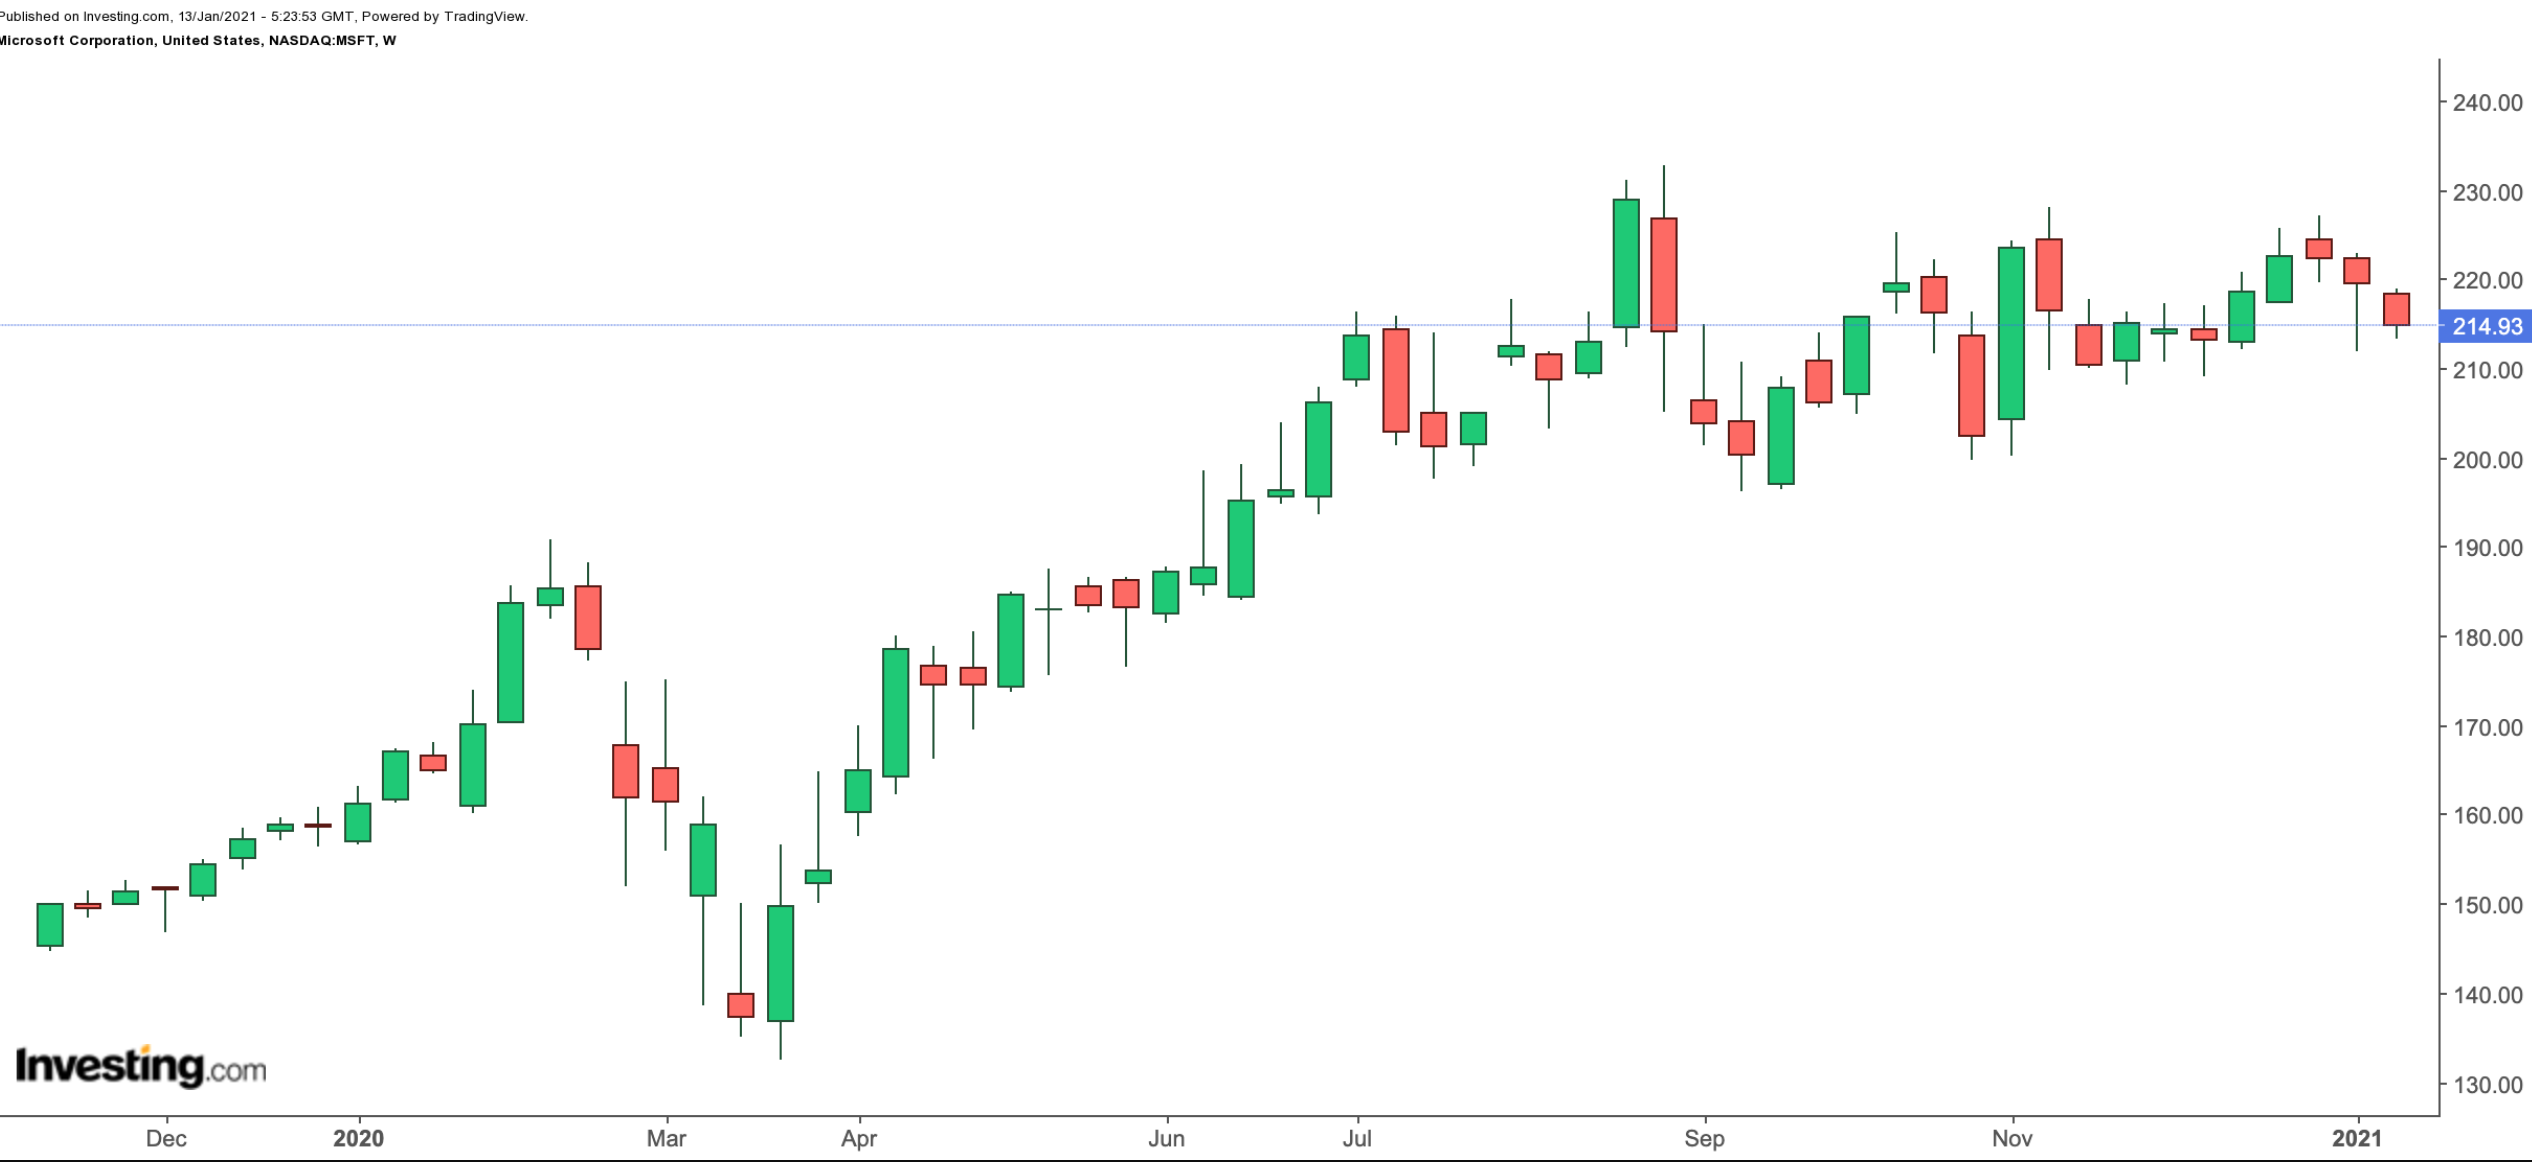
Microsoft (NASDAQ:MSFT) was one of the darlings of Wall Street in 2020. In the past 52 weeks, the shares returned about 33%. On Sept. 2, the stock saw a record-high $232.86.

As a mega-cap company with a valuation of more than $1.6 trillion, that kind of growth is significant and impressive. MSFT's stock price currently hovers at $215 and supports a dividend yield of 1.05%.
In October 2019, the coveted tech name became a member of the Dow Jones Industrial Average. Over the past year, the DJIA returned 7.5%.
Microsoft released FY21 Q1 earnings in late October. Revenue of $37.2 billion meant an increase of 12% year-over-year (YoY). Net income of $13.9 billion was up 30% YoY. Similarly, diluted earnings per share (EPS) of $1.82 was up 32%, compared with Q1 last year.
The Redmond, Washington-based company will release earnings after the market closes on Jan. 26. Given the recent increase in MSFT shares as well as other tech shares, short-term profit-taking could well be around the corner. Forward P/E and P/S ratios of 32.26 and 11.33 are on the high side historically.
MSFT is currently overbought. Although a momentum stock can stay overbought for a long time, we expect the shares to take a breather in the coming days. However, any potential decline would also mean a better entry point for long-term market participants.
Buy-and-hold investors wanting to participate in the potential returns that Microsoft shares could offer in 2021 may consider buying an exchange-traded fund (ETF) that includes MSFT stock. This could potentially diversify some of the short-term volatility that could come with owning the shares on their own.
There are well over 300 ETFs that include Microsoft among their holdings. Here's a look at two.
1. Vanguard Information Technology Index Fund ETF
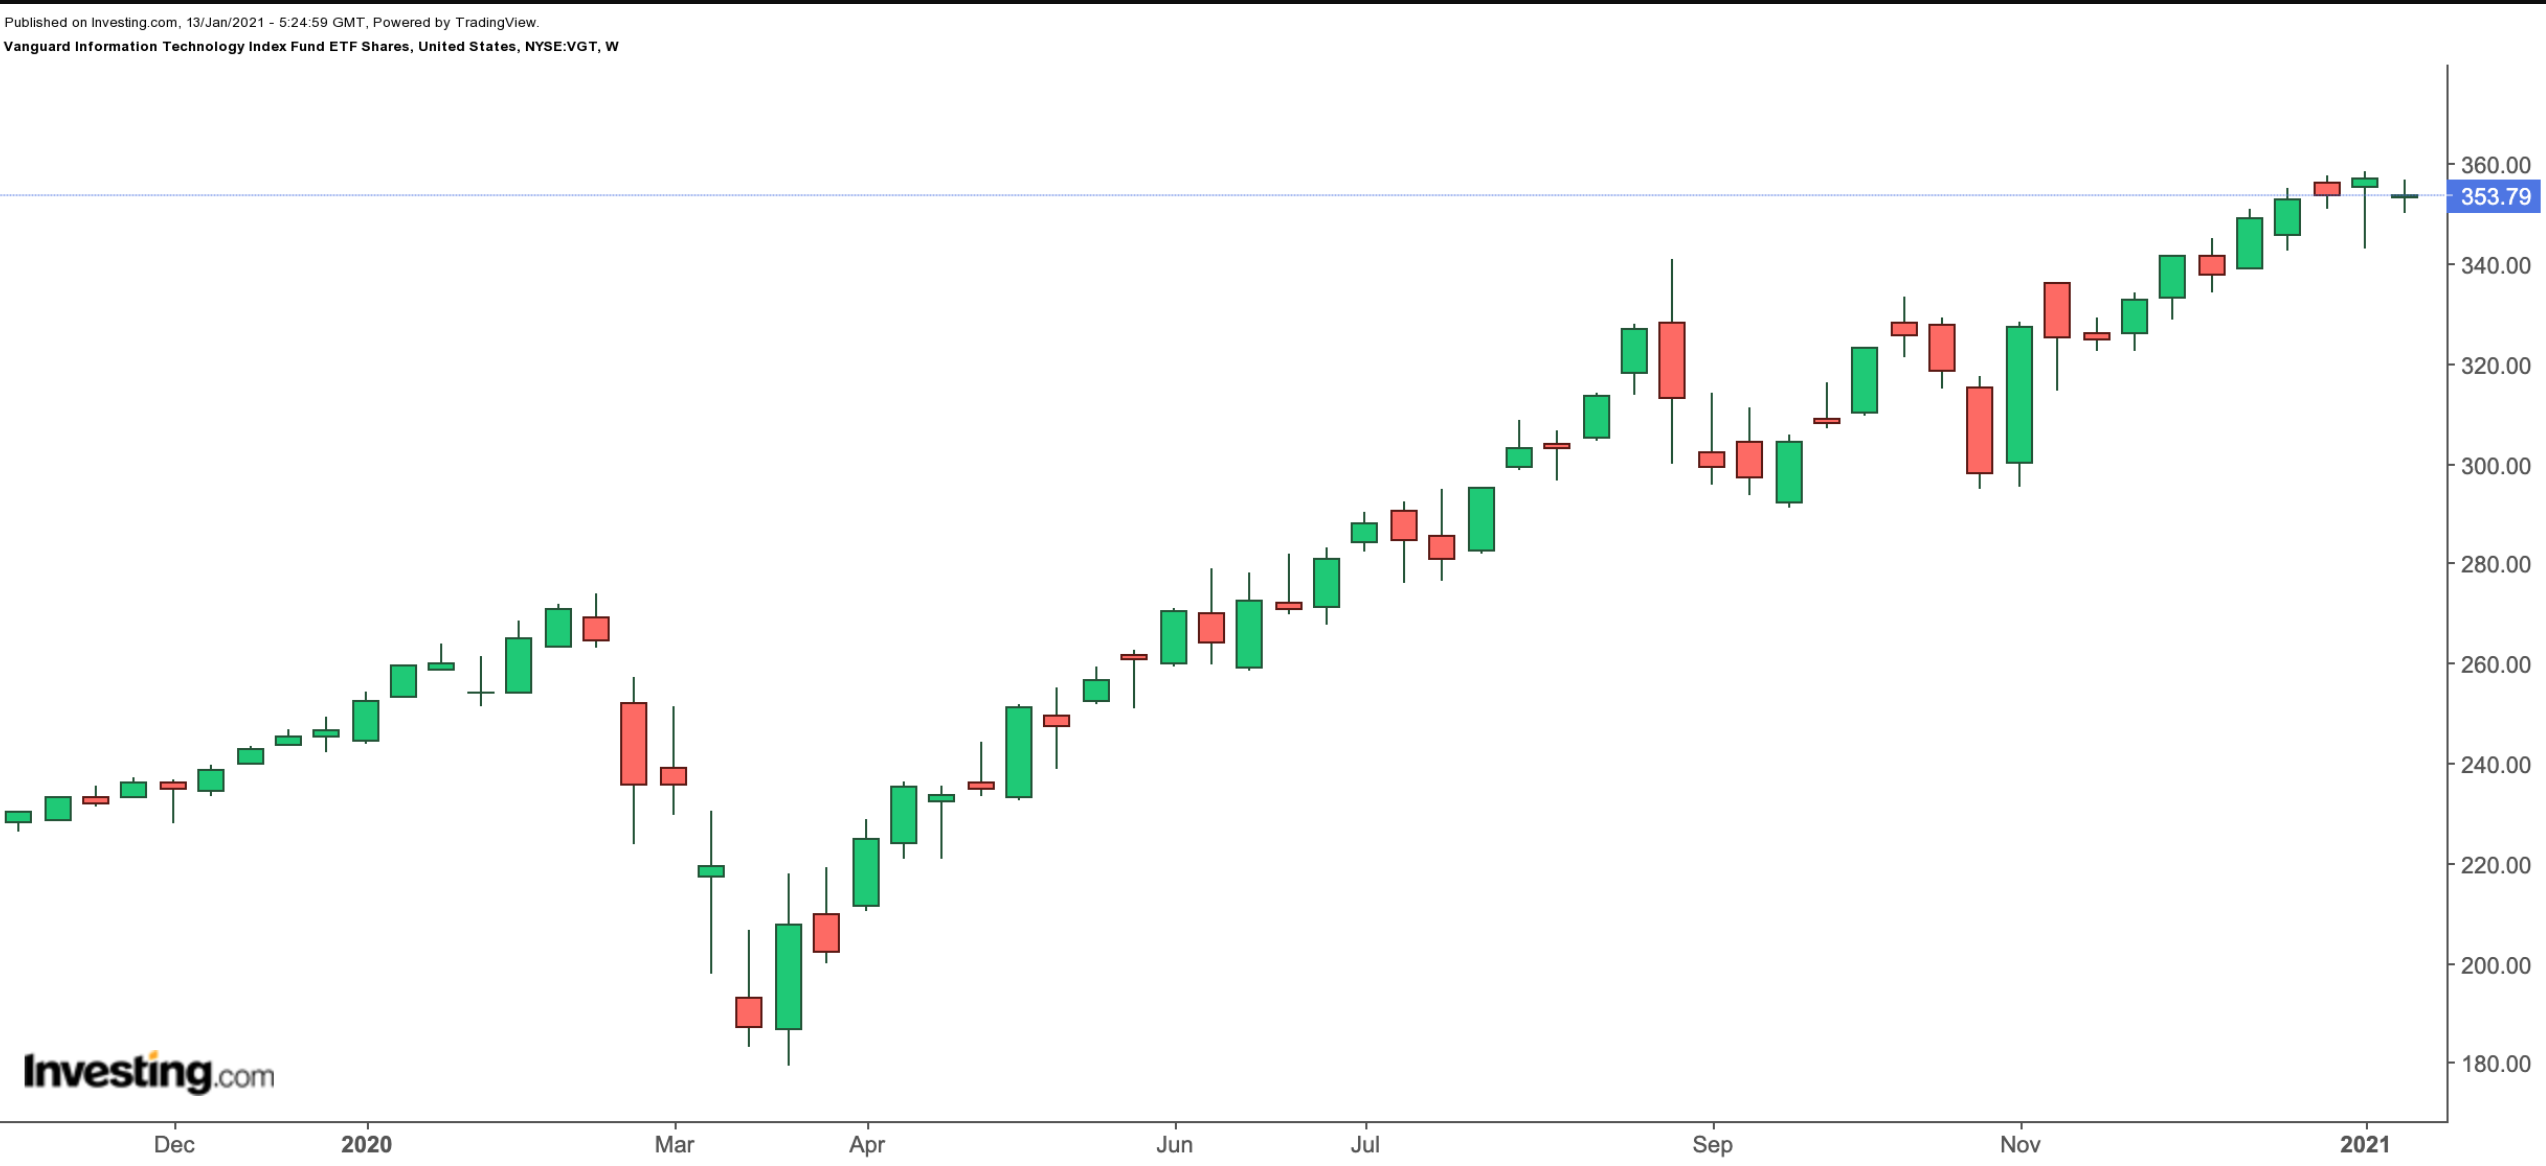
Current Price: $353.79
52-Week Range: $179.45 - $358.67
Dividend Yield: 0.82%
Expense Ratio: 0.10%
The Vanguard Information Technology Index Fund ETF (NYSE:VGT) gives access to a wide range of U.S. information technology (IT) businesses. The sector has been the catalyst for the growth in broader equity markets over the past decade. Since the fund's inception in January 2004, net assets have reached $44.4 billion.

VGT, which includes 330 stocks, tracks the returns of the MSCI US IMI Info Technology 25/50 Index. The most important sectors are Technology Hardware, Storage & Peripherals (21.9%), Systems Software (19.4%), Semiconductors (15.8%), Data Processing & Outsourced Services (14.1%), Application Software (14.2%) and others.
Close to 60% of the fund's assets are in the top 10 stocks. Apple (NASDAQ:AAPL), Microsoft, Visa (NYSE:V), NVIDIA (NASDAQ:NVDA), Mastercard (NYSE:MA) and PayPal (NASDAQ:PYPL) lead the names in the roster. AAPL and MSFT stocks' weightings are 20.60% and 15.60%, respectively. No other stock currently has more than a 3.4% weight in the ETF. This means moves in either AAPL or MSFT are likely to affect the fund's price.
Over the past year, VGT returned about 40%, hitting an all-time high early this month. As a result, its trailing P/E and P/B ratios of 35.4 and 9.4 indicate an overstretched valuation. In the case of short-term profit-taking, potential investors could find better value around $330.
The fund could be appropriate for investors wanting to invest in Microsoft and Apple as well as a diverse range of technology stocks. Despite occasional pullbacks, tech stocks will possibly remain one of the hottest items in U.S. markets.
2. Schwab US Large-Cap Growth ETF
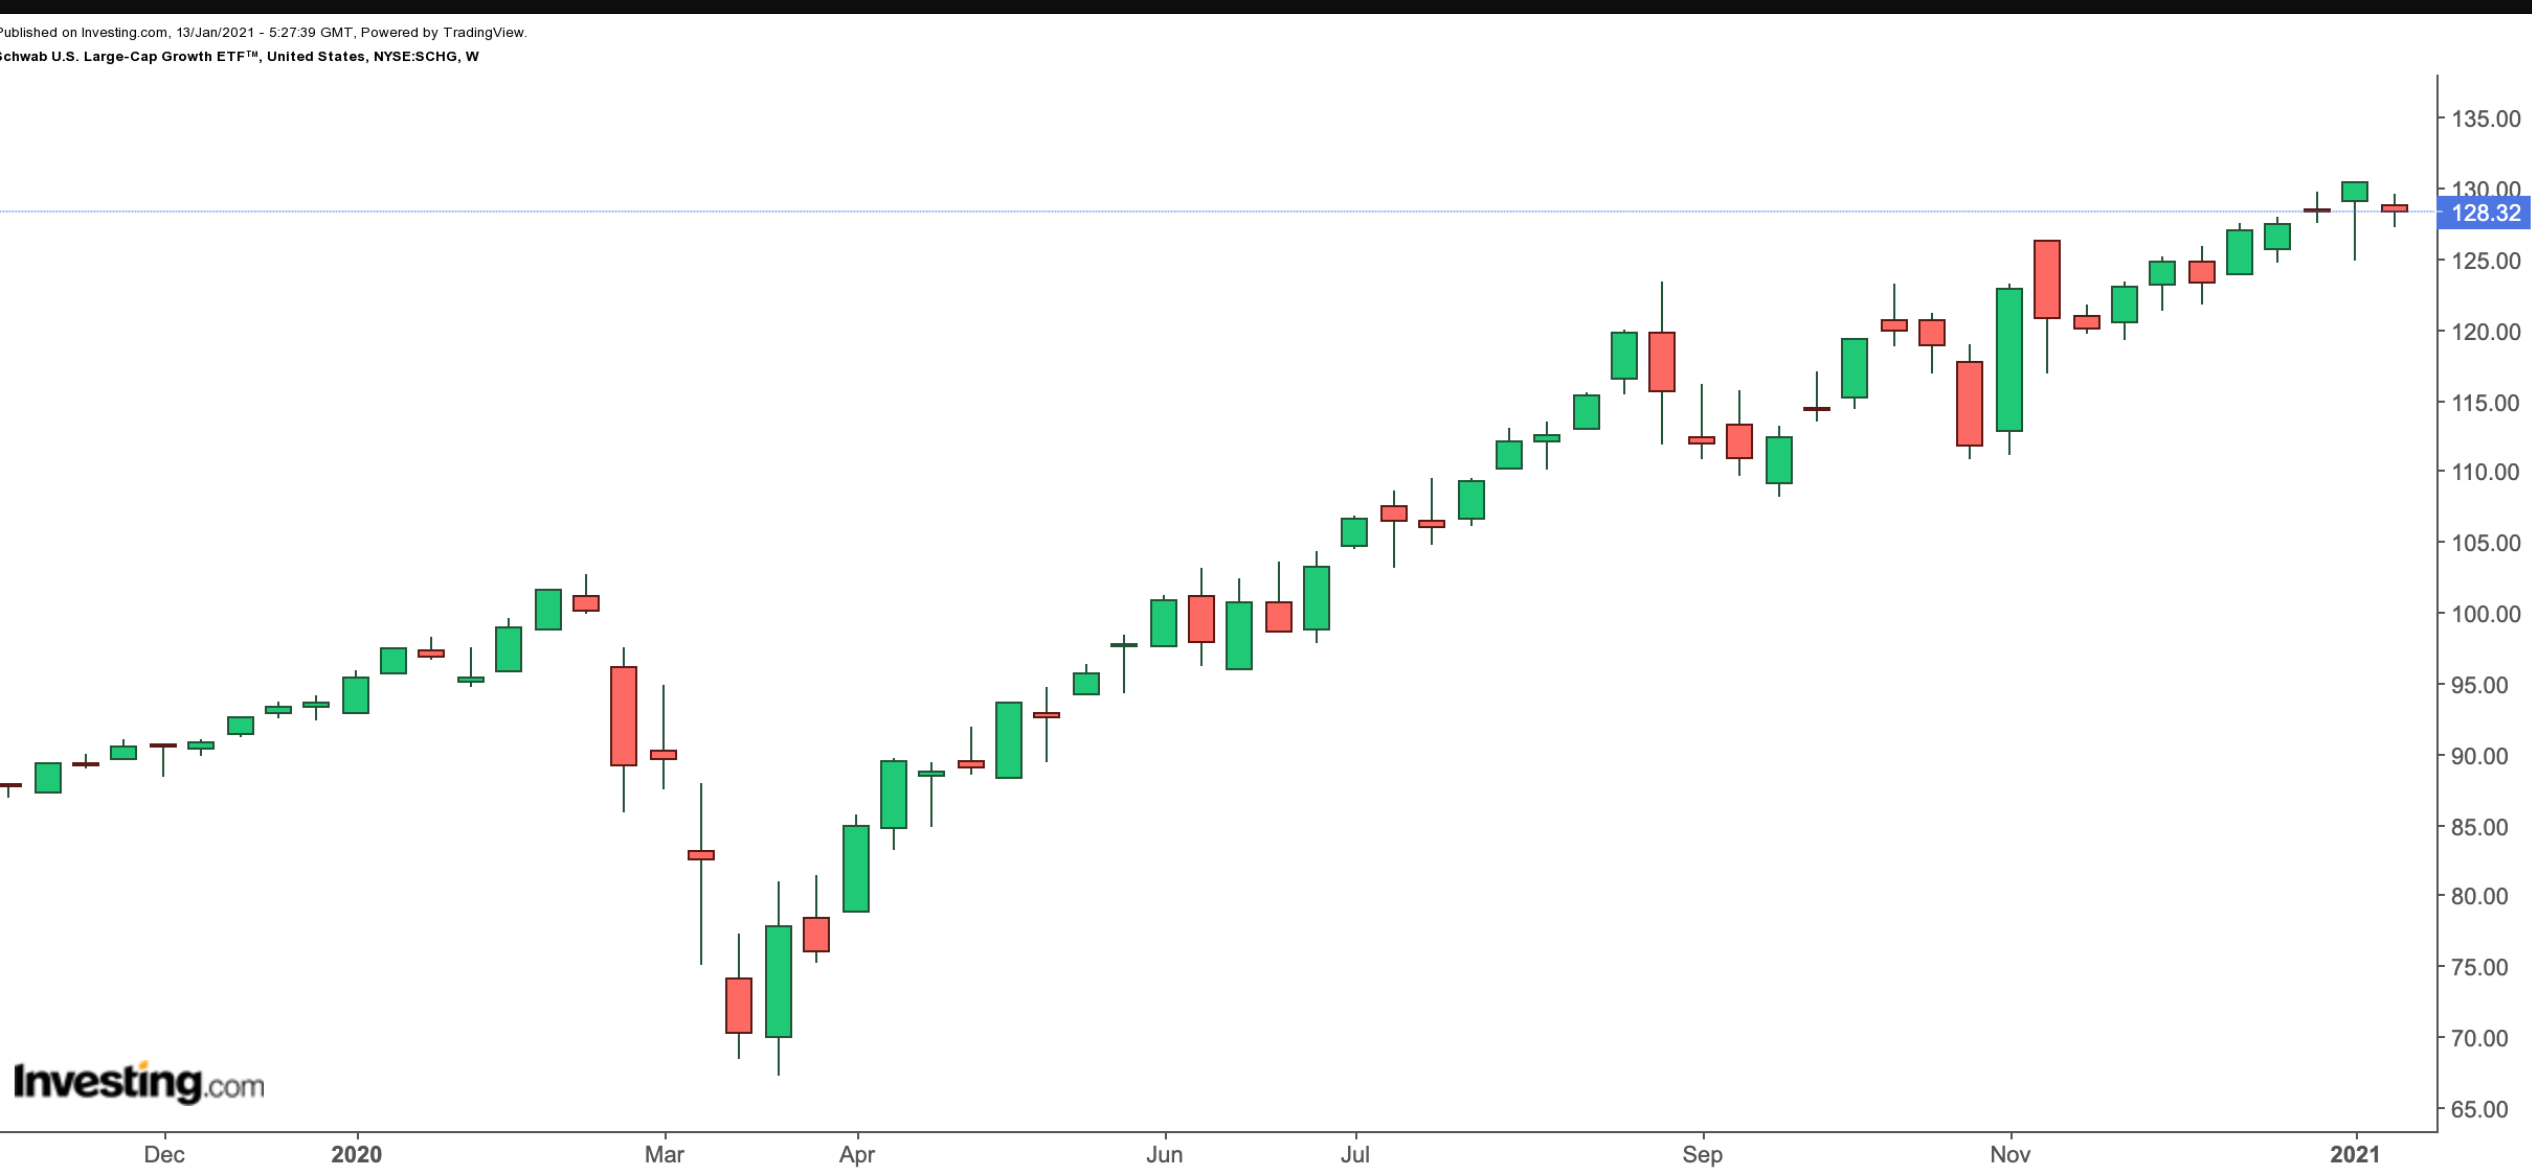
Current Price: $128.32
52-Week Range: $67.25 - $130.52
Dividend Yield: 0.72%
Expense Ratio: 0.04%
Our second fund is the Schwab U.S. Large-Cap Growth ETF™ (NYSE:SCHG), giving access to U.S.-based large-cap growth stocks. While the definition of large-caps may vary slightly across brokerages, a company with a market capitalization of more than $10 billion is typically considered a large-cap business. More than 75% of the companies in the fund have markets caps above $70 billion.

SCHG, which tracks the Dow Jones U.S. Large-Cap Growth Total Stock Market Index, has 230 holdings. The fund started trading in November 2009 and assets under management stand at $13.7 billion.
As far as the sectors are concerned, IT has the highest weighting (45.54%), followed by Consumer Discretionary (16.39%), Communication Services (14.50%), Health Care (12.69%) and Industrials (3.34%).
The top 10 holdings make up 42% of the fund. Like VGT, Apple and Microsoft lead the fund with 12.68% and 9.98% stakes, respectively. Other heavyweights include Amazon.com (NASDAQ:AMZN), Tesla (NASDAQ:TSLA), Facebook (NASDAQ:FB) and Alphabet (NASDAQ:GOOG), (NASDAQ:GOOGL).
In the past year, SCHG has returned about 34%. Trailing P/E and P/B ratios are 41.23 and 8.69, respectively, putting the valuation on the frothy side. A potential decline toward $115 would improve the margin of safety.
