FOMC Minutes:
With yesterday’s RBA monetary policy minutes not offering us anything new, we move onto tonight’s US inflation data and FOMC minutes.
With Fed speakers indicating that inflation is still a key driver of the timing of the imminent rate hike, tonight’s CPI data will give us a heads up on whether the economy is still moving toward the Fed’s 2% target. On the other hand, the FOMC minutes look backward to the previous meeting and with all the Chinese currency shenanigans between then and now not featuring in any of the discussions, the lag factor may feature in the way traders digest what is said.
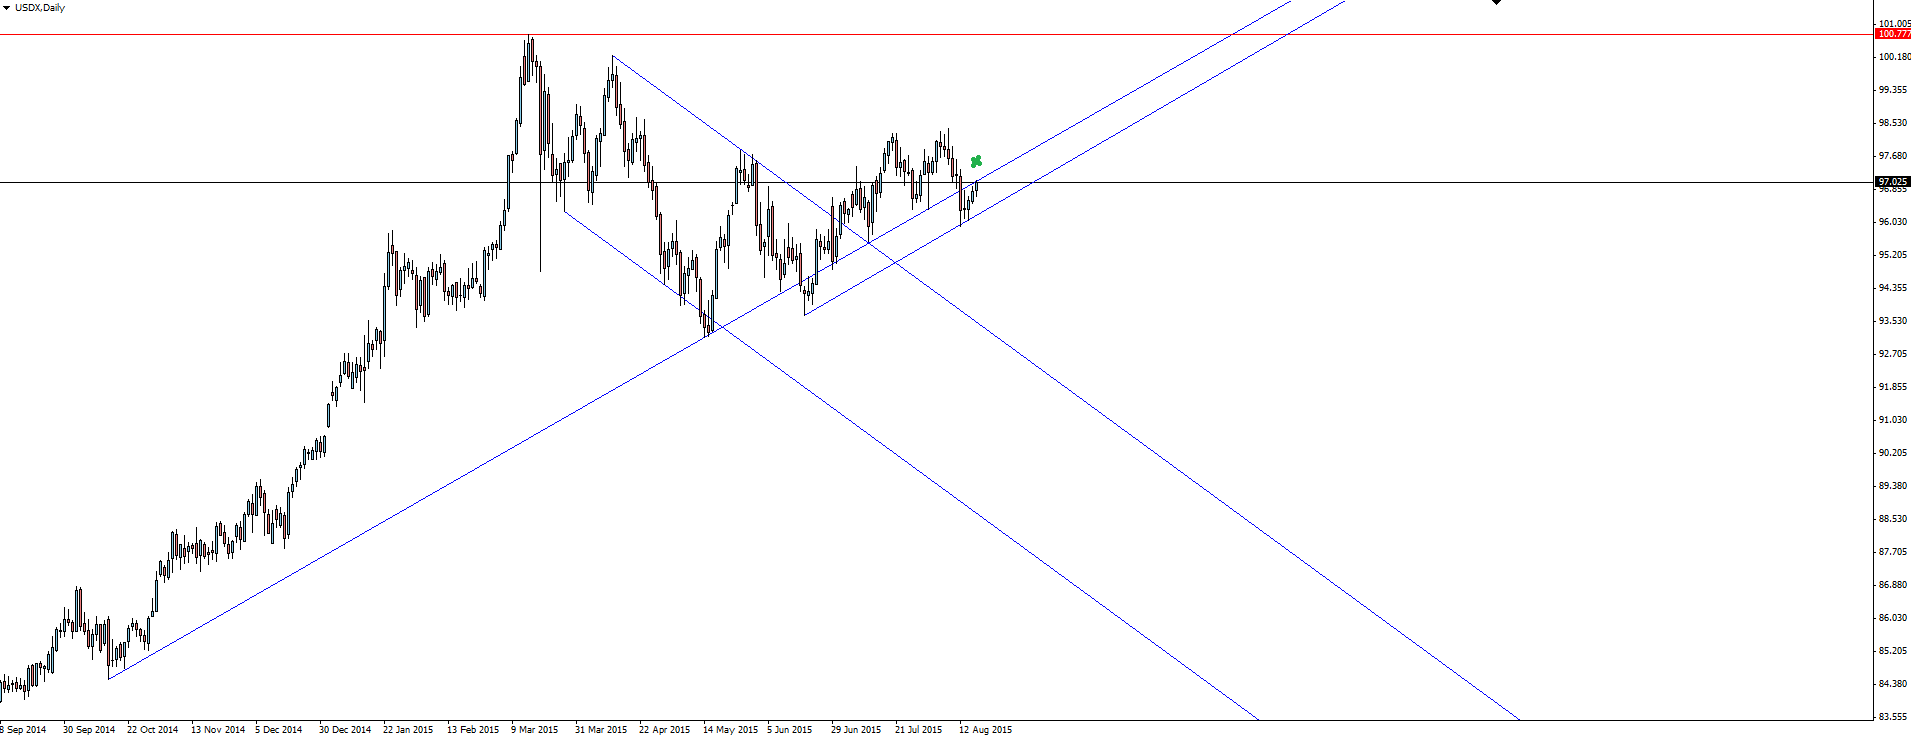
Taking a look at the USDX daily chart, we can see that price has broken through major trend line support but lacked conviction and has since pulled back to possibly re-test the level. Just another example of price sitting on a major technical level that the fundamentals will decide.
USDX Daily:

The key message to look for will be any comments around data supporting a September liftoff, followed by how gradual the nature of any subsequent hike will be. With current CPI data having been released before the previous meeting’s minutes, a spanner could be thrown into the works if it diverges from any previous inflation data comments.
Possible GBP Turning Point:
Some comments from the Bank of England’s Miles this morning have put their own rate hiking cycle in focus again:
“BoE’s Miles: Turning point on rates is coming pretty soon.”
“Hike would be a sign of strength in the economy.”
With UK inflation data also picking up enough to inspire the market, the GBP pairs are seeing some divergence away from the pure USD driven moves seen across some of the other currencies.
![]()

We take a look at GBP/JPY in the chart of the day section below and keep an eye out on social media for an upcoming GBP/USD focused post in the Technical Analysis section of the Vantage FX News Centre.
On the Calendar Wednesday:
JPY Trade Balance (-0.37T v -0.16T expected)
USD CPI m/m
USD Core CPI m/m
USD FOMC Meeting Minutes
Chart of the Day:
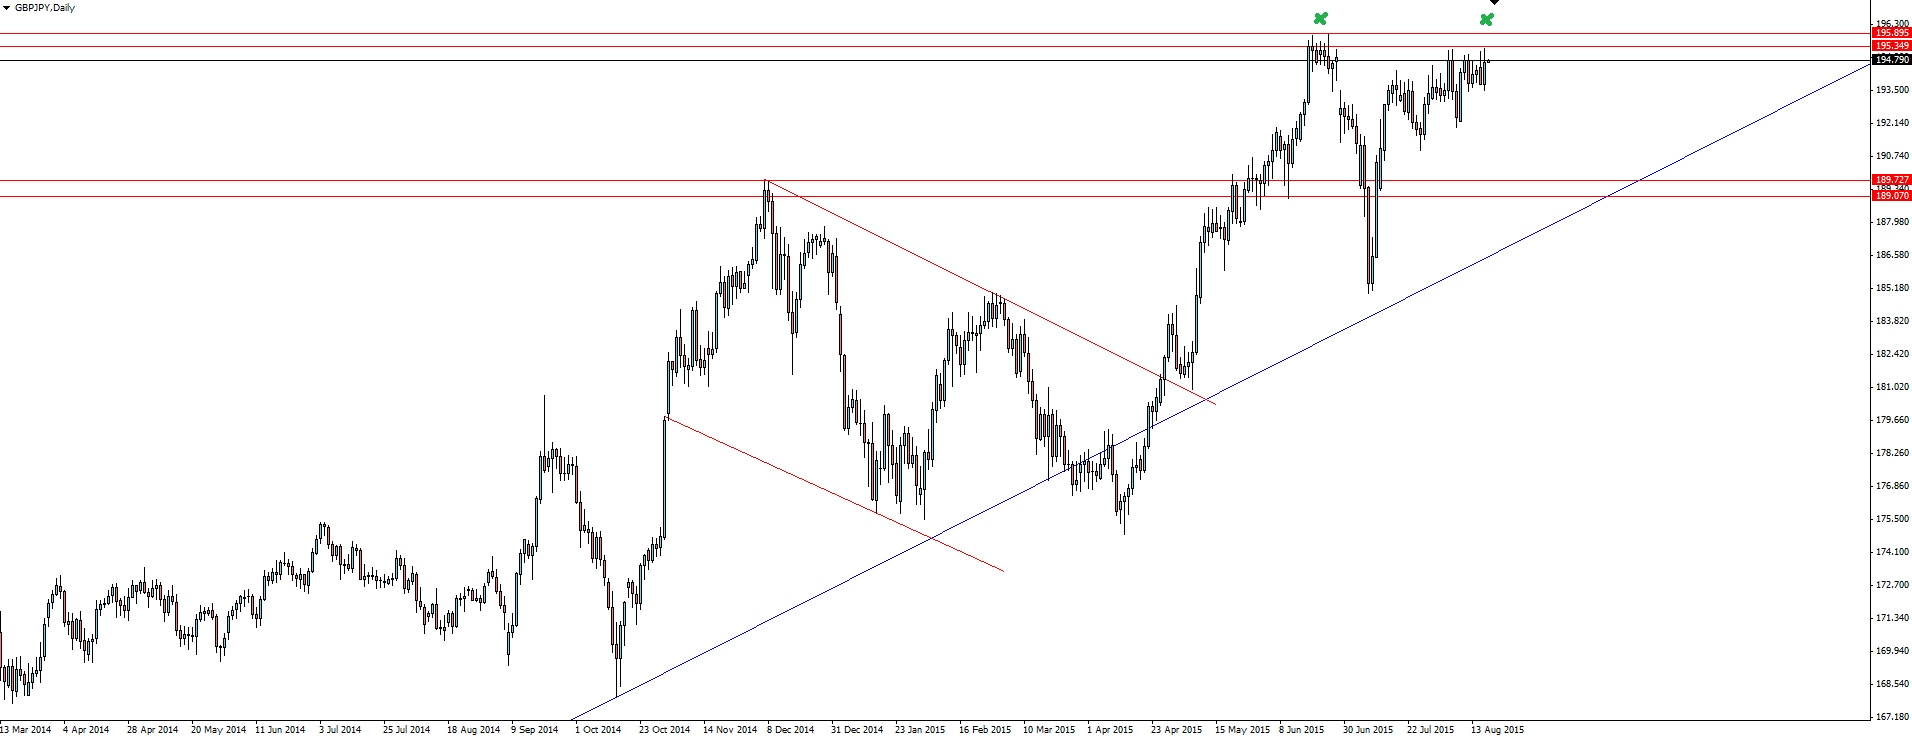
With GBP/JPY approaching swing highs, we today take a look at the beast!
GBP/JPY Daily:

Since bottoming in 2011, the next 4 years of trading has seen the beast go almost vertical to where we are now. If you take a look at the weekly time frame on your own charts, you can see that the current level is an area of previous support/resistance in 2008, 1996 and even as far back as 1992!
GBP/JPY 4 Hourly:

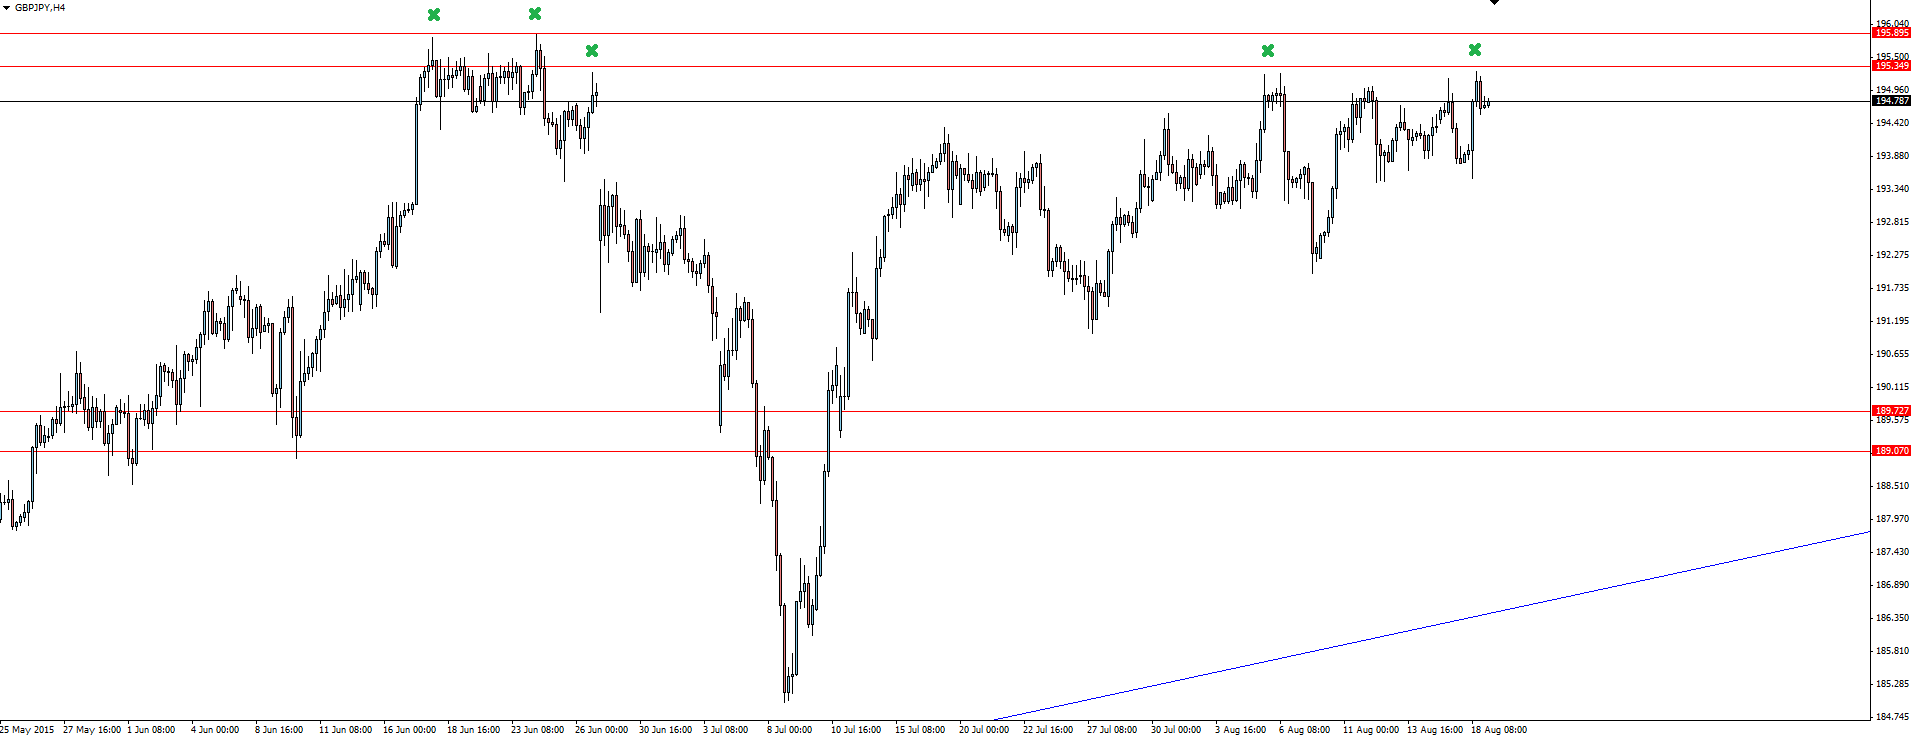
With the previous swing high rejection we have marked on the 4 hourly chart letting us know that the level is active again, we can look to use the level to manage our risk around.
Risk Disclosure: In addition to the website disclaimer below, the material on this page prepared by Vantage FX Pty Ltd, does not contain a record of our trading prices, or an offer of, or solicitation for, a transaction in any financial instrument. The research contained in this report should not be construed as a solicitation to trade. All opinions, news, research, analyses, prices or other information is provided as general market commentary and marketing communication – not as investment advice. Consequently any person acting on it does so entirely at their own risk. The experts writers express their personal opinions and will not assume any responsibility whatsoever for the actions of the reader. We always aim for maximum accuracy and timeliness and Vantage FX shall not be liable for any loss or damage, consequential or otherwise, which may arise from the use or reliance on the service and its content, inaccurate information or typos. No representation is being made that any results discussed within the report will be achieved, and past performance is not indicative of future performance.
