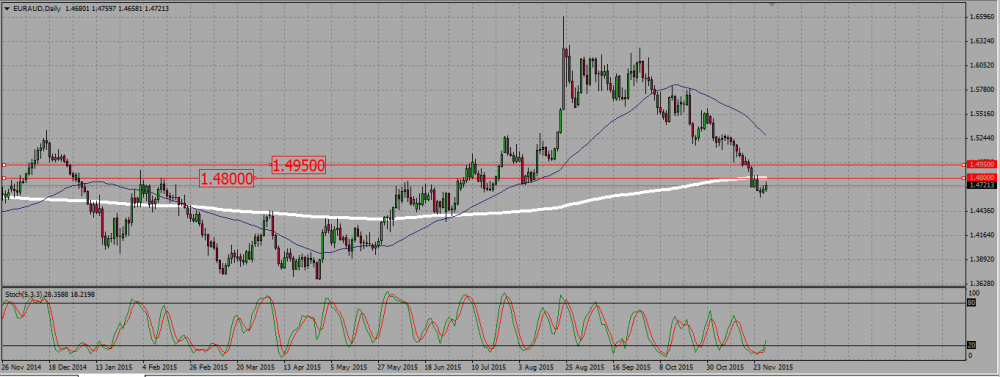
EUR/AUD broke down the 200 SMA on the daily chart and looks like it wants to retest it. As we can see from the chart, this SMA is a really good support/resistance level for that pair, and I will sell any signals on its retest. On the opposite side, a clear bullish signal would trigger a buy towards 1,495. 
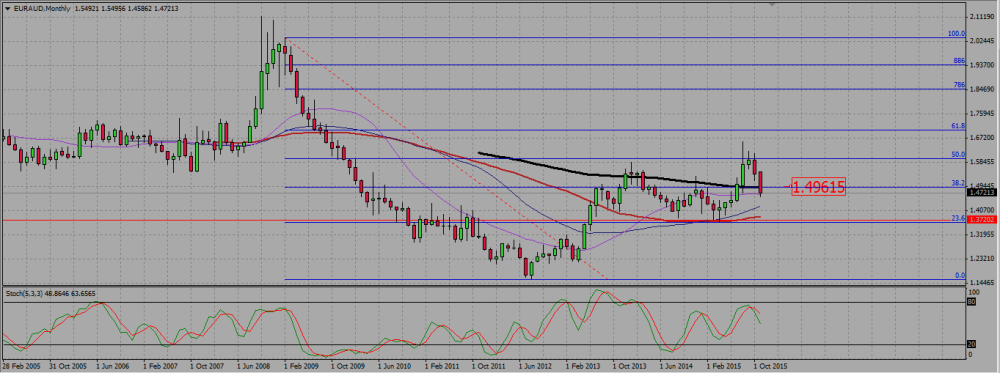
The monthly chart shows the pair entered a bearish consolidation two months ago. It broke a support near 1,495, and this will be may take profit level on a long trade, as the pair may still retest that zone.

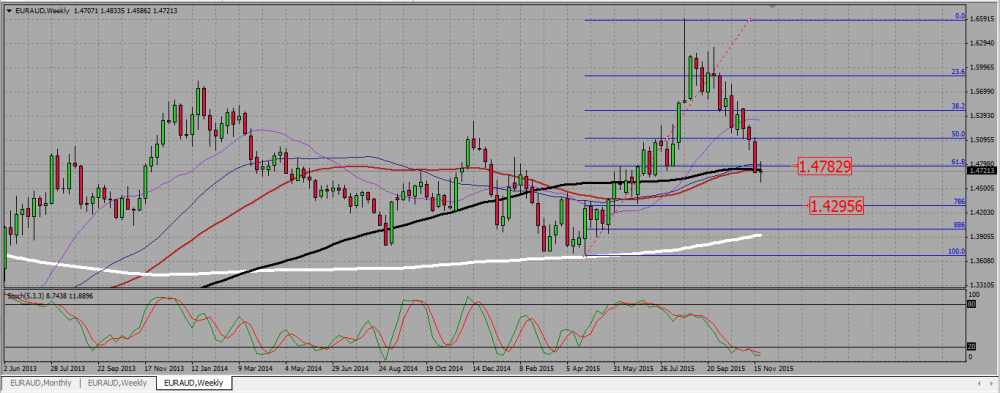
The weekly chart shows the pair broke a 61,8 Fibonacci retracement at 1,4785, adding to the weight of that zone as a resistance -the daily 200 SMA is around 1,48- A bearish break out would open the way to the 0,786 Fibonacci level around 1,43. 
