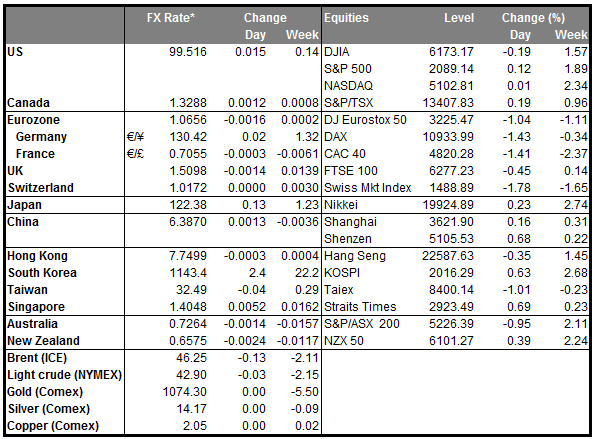
• Dollar falls while yen and commodity currencies rally The dollar weakened as investors continued to cut long positions ahead of the Thanksgiving holiday, while geopolitical tensions after Turkey downed a Russian warplane caused a flight-to-safety. Rising tensions and fears of an escalation between the two countries hurt the equity markets and pushed investors to shift their funds to the yen and to a lesser extent to the Swiss franc. The Russian President warned of “serious consequences”, which not necessarily mean a military response but point to the strong economic ties the two countries have. As a result, deteriorating economic conditions are likely to weigh further on the TRY and to the RUB, as the tensions increase between the two sides.
• In the meantime, the commodity currencies AUD, CAD and NZD performed well, in part to a minor rebound in oil prices. On top of that, the AUD gained further as RBA Governor Glenn Stevens dampened expectations for further rate cuts at the RBA policy meeting next week. He said “we've got Christmas, we should just chill out, come back and see what the data says." Given that the benchmark price of iron ore, one of Australia’s major exports, declined further, I believe that any advances in AUD/USD are likely to stay limited. I would prefer to exploit AUD strength against NZD.
• Today’s highlights: During the European day, Norway’s AKU unemployment rate for September is due to be released. The figure is expected to remain unchanged at 4.6%. The registered unemployment rate for the same month declined a bit, which could lead to a positive surprise in the AKU rate as well. Given that this data are outdated, we expect the market reaction to be minimal. In Sweden, the Riksbank publishes its Financial Stability Report and from France, we get the consumer confidence for November.
• In the US, we have a very busy day ahead of the Thanksgiving holiday. The headline and core durable goods orders are expected to have increased, after falling or stagnating for two consecutive months. The headline figure is forecast to have risen 1.5% mom, a turnaround from -1.2% mom in September, while durable goods excluding transportation equipment are estimated to be up 0.3% mom, a rebound from -0.3% mom previously. The focus is usually on the core figure, where a possible improvement could boost the greenback. Personal income and personal spending are expected to have risen at a faster pace than in September. Improvement in consumption for the first month of the year’s final quarter could be a sign for a rebound in the US growth rate following the slowdown in Q3. This could add to the growing body of evidence that the US economy is gaining momentum and may support USD. The yoy rates of the PCE deflator and core PCE for October are coming out as well.
• Initial jobless claims for the week ended Nov. 20 are expected to have declined slightly from the previous week. However, the 4-week moving average will rise if the forecast is met. The overall trend though still points to a strong labor market and I don’t expect a moderate increase to hurt the greenback or to alter expectations of a December rate hike. The preliminary US Markit service-sector PMI and the final University of Michigan consumer sentiment index, both for November, are also due to be released.
• In the late US session, New Zealand’s trade deficit for October is expected to decline a bit. This may prove NZD-positive.
• We have three speakers on Wednesday’s agenda: ECB Vice President Vitor Costancio, RBA Assistant Governor Guy Debelle, and UK finance Minister George Osborne speak.
The Market
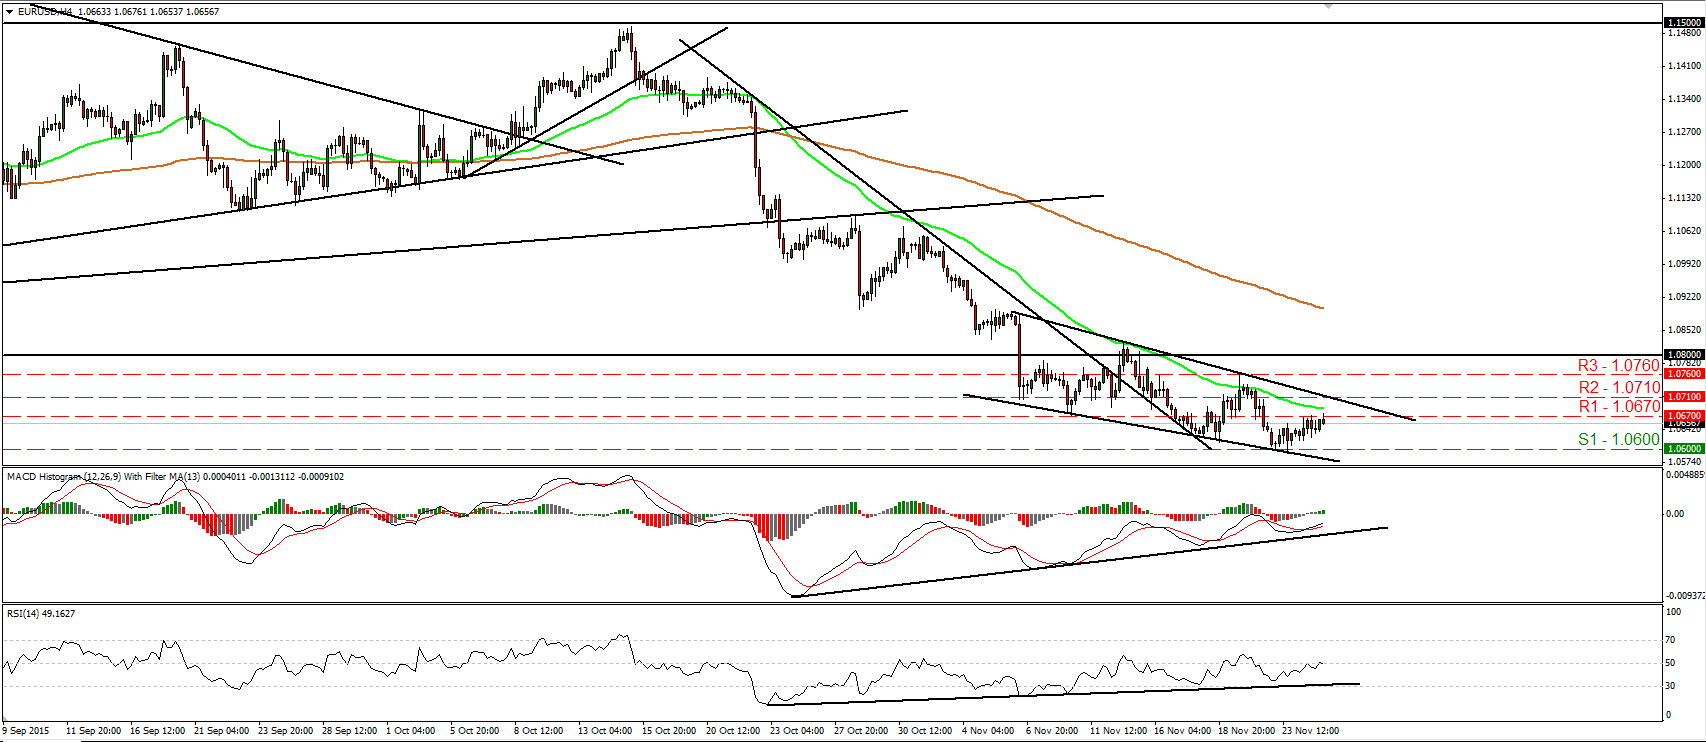
EUR/USD stands near 1.0670
• EUR/USD traded somewhat higher yesterday, but the advance was stalled near 1.0670 (R1). The short-term trend remains negative in my view and therefore, I would expect a clear break below 1.0600 (S1) to confirm a forthcoming lower low on the 4-hour chart and to open the way for our next support of 1.0570 (S2), defined by the low of the 15th of April. Taking a look at our momentum studies though, I see signs that yesterday’s rebound may continue for a while. The RSI continued higher and is now testing its 50 line, while the MACD, although negative, has crossed above its trigger line and now points up. Also, there is still positive divergence between both these indicators and the price action. In the bigger picture, as long as the pair is trading below 1.0800, the lower bound of the range it had been trading since the last days of April, I would consider the longer-term outlook to stay negative. I would treat any possible near-term advances that stay limited below 1.0800 as a corrective phase.
• Support: 1.0600 (S1), 1.0570 (S2), 1.0530 (S3)
• Resistance: 1.0670 (R1), 1.0710 (R2), 1.0760 (R3)
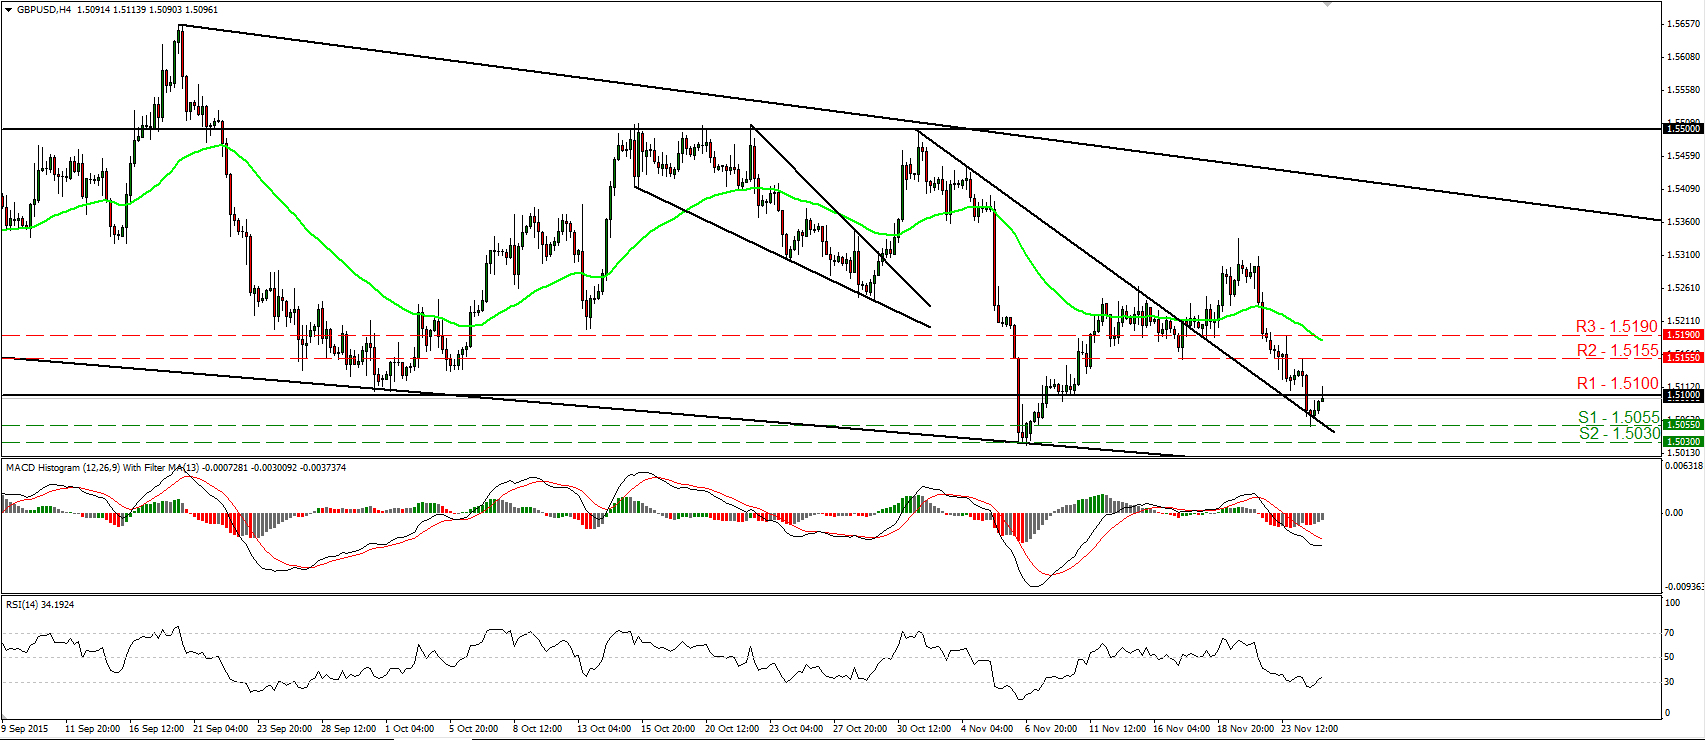
GBP/USD falls below 1.5100
• GBP/USD traded lower on Tuesday, falling below the support (now turned into resistance) hurdle of 1.5100 (R1). However, the decline was stopped at 1.5055 (S1) and then it rebounded. The short-term picture remains negative in my view and I would expect the bears to take in charge again at some point and drive the battle towards the 1.5030 (S2) area, marked by the low of the 6th of November. Looking at our oscillators though, I see signs that the corrective bounce may continue for a while. The RSI rebounded from slightly below its 30 line, while the MACD, although negative, shows signs of bottoming. Another move above 1.5100 (R1) could aim for the next resistance of 1.5155 (R2). On the daily chart, I see that the rebound started on the 6th of November was stopped fractionally below the 80-day exponential moving average. Then, the rate tumbled again. As a result, I would keep my view that the medium-term outlook remains cautiously negative.
• Support: 1.5055 (S1), 1.5030 (S2), 1.5000 (S3)
• Resistance: 1.5100 (R1), 1.5155 (R2), 1.5190 (R3)
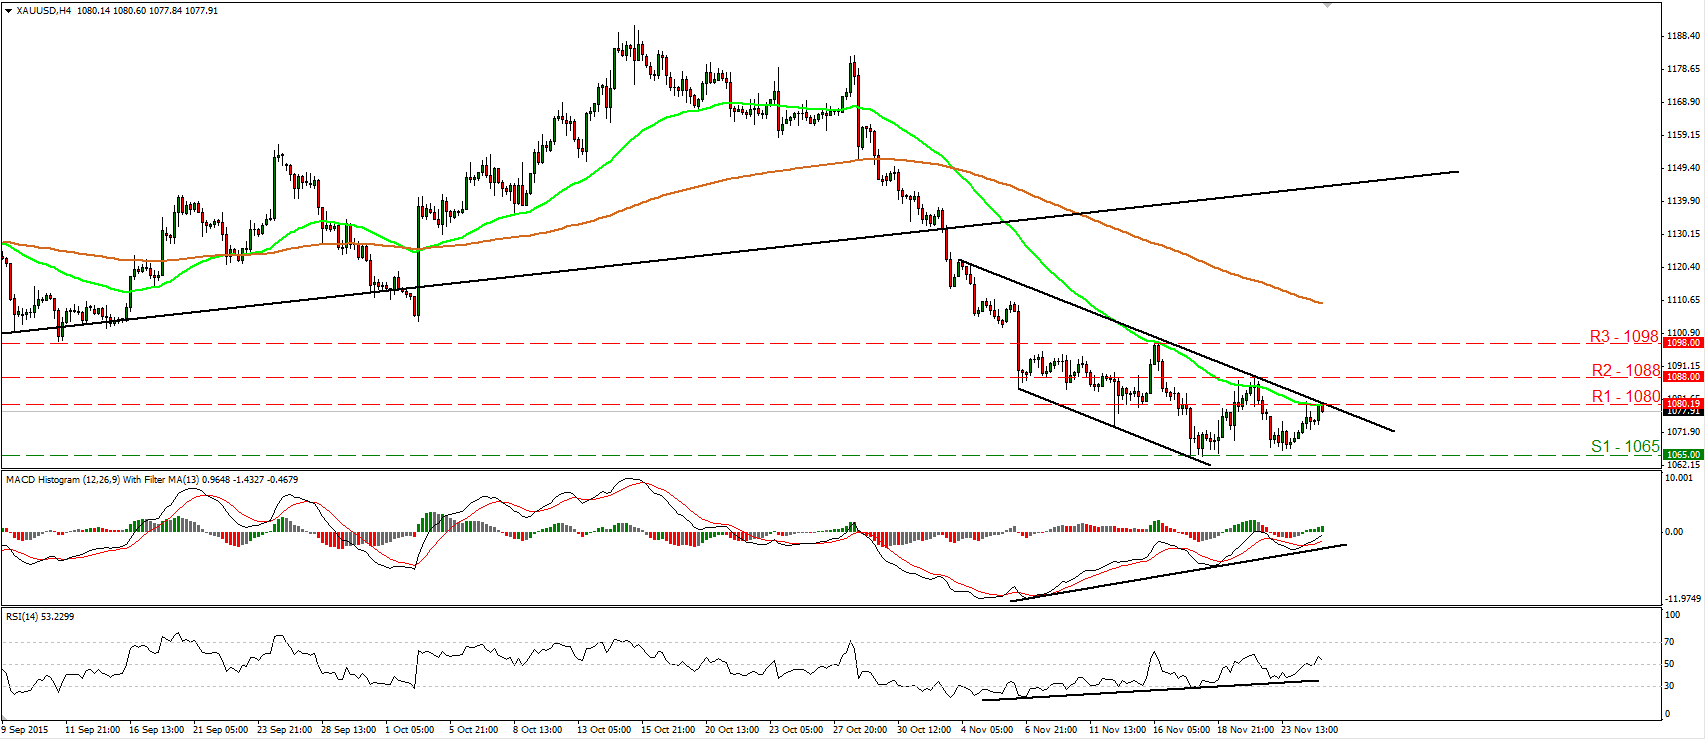
Gold rebounds and hits 1080
• Gold continued trading higher yesterday and managed to hit the 1080 (R1) level and the upper bound of the short-term downside channel that has been containing the price action since the 4th of November. The fact that the metal remains within that channel keeps the technical picture negative. However, I see signs that the price could emerge above 1080 (R1), something that could initially aim for the next resistance zone of 1088 (R2). Our short-term oscillators support somewhat the notion. The RSI rebounded from near its upside support line and crossed above 50, while the MACD has bottomed, moved above its trigger line, and looks able to turn positive soon. What is more, there is still positive divergence between both these studies and the price action. On the daily chart, I see that the plunge below the upside support line taken from the low of the 20th of July has shifted the medium-term outlook to the downside. As a result, I believe that the metal is poised to continue its down road in the foreseeable future and I would consider any possible near-term advances as a corrective phase at the moment.
• Support: 1065 (S1), 1055 (S2), 1050 (S3)
• Resistance: 1080 (R1), 1088 (R2), 1098 (R3)
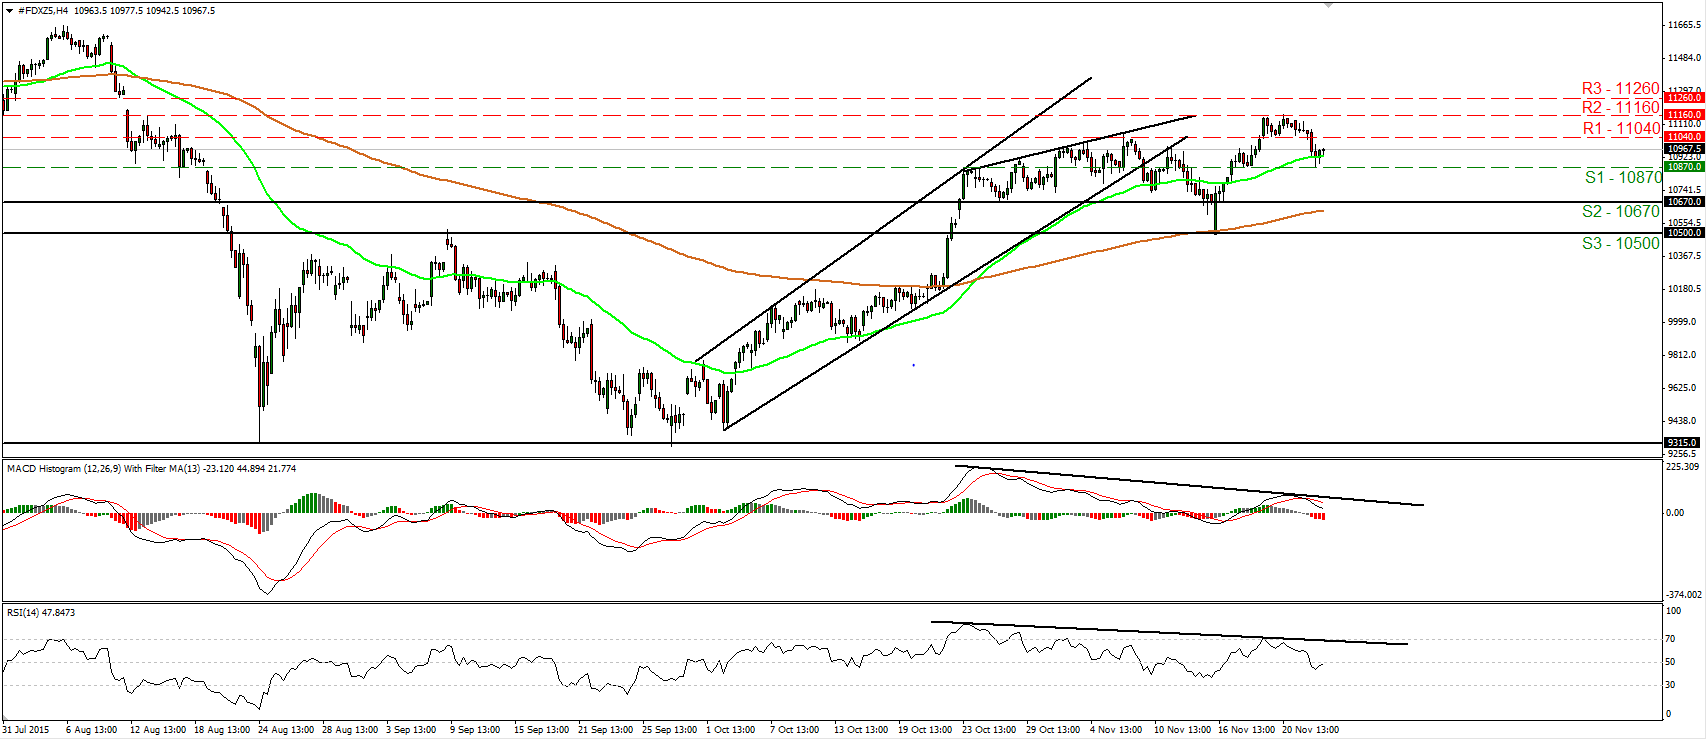
DAX futures correct lower
• DAX futures traded lower yesterday, falling below the support (now turned into resistance) line of 11040 (R1). The decline was stopped by our next support of 10870 (S1), but I see signs that it could continue. A clear move below 10870 (S1) could prompt extensions towards the key zone of 10670 (S2). Our momentum studies corroborate my view and amplify the case that further declines could be on the cards. The RSI shows signs of topping slightly below its 50 line, while the MACD, although positive, stands below its trigger line and points down. There is also negative divergence between both the indicators and the price action. On the daily chart, the break above the psychological zone of 10500 on the 22nd of October signalled the completion of a double bottom formation. What is more, the rebound on the 16th of November from that psychological area adds to my view that the medium-term path remains positive. Thus, I would consider yesterday’s pullback or any extensions of it that stay limited above 10500 as a corrective phase for now.
• Support: 10870 (S1), 10670 (S2), 10500 (S3)
• Resistance: 11040 (R1), 11160 (R2), 11260 (R3)
USD/JPY headed towards 122.20
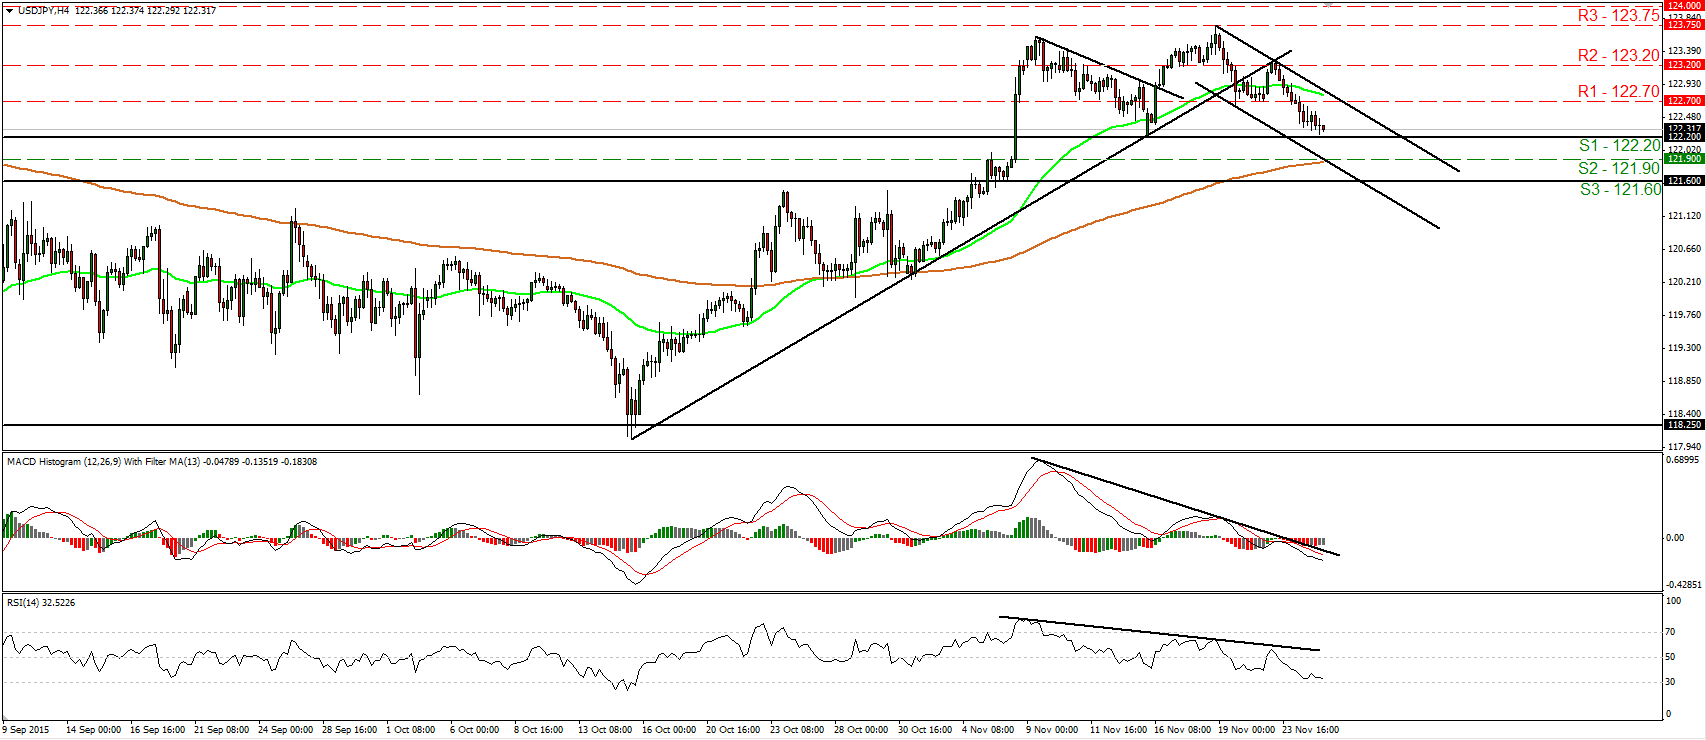
• USD/JPY traded lower on Tuesday falling below the support (now turned into resistance) barrier of 122.70 (R1). Today, during the early European morning, the rate looks to be headed towards the key support zone of 122.20 (S1), where a clear break is likely to signal the completion of a double top formation and perhaps turn short-term outlook negative. Our short-term oscillators reveal negative momentum and confirm the recent declines. The RSI edged down and is now approaching its 30 line, while the MACD stands below both its zero and trigger lines. There is also negative divergence between both the indicators and the price action, something that increases the possibilities for a move below 122.20 (S1). As for the broader trend, the break above 121.60 (S3) signaled the upside exit of the sideways range the pair had been trading since the last days of August and turned the longer-term picture back positive. This supports that USD/JPY could continue higher in the not-too-distant future and thus, I would treat any possible future near-term declines that stay limited above that area as a corrective phase for now.
• Support: 122.20 (S1), 121.90 (S2), 121.60 (S3)
• Resistance: 122.70 (R1), 123.20 (R2), 123.75 (R3)

