
- The red metal soars to a decade high
- Stockpiles are low, but manipulation is common
- The case for new record highs in copper
- Risk rises with the price
- Levels to watch: Producers are golden, but costs are rising
Copper}, the red, nonferrous metal that is an excellent conductor of electricity, is a commodity with many industrial and construction applications. Copper is also the leader of the metals that trade on the London Metals Exchange in the commodity asset class’s base metals sector.
Many market participants refer to it as “Doctor Copper” because its gyrations have often been seen as a 'tell' on where economic expansion may be headed—its price tends to rise during periods of global economic growth and fall when the economy contracts. Chile is the world’s leading copper-producing nation, and China is the demand side of the fundamental equation. Infrastructure building has spurred China’s almost unending appetite for copper and other base metals and industrial commodities.
In March 2020, as the global pandemic caused risk-off price action in markets across all asset classes, copper’s price fell to its lowest level since June 2016 when nearby COMEX futures declined to a low of $2.0595 per pound. Since then, copper has been nothing short of explosive, with the price reaching the highest level in a decade at the end of February.
Copper traded to $4.3755 per pound on the May COMEX futures contract on Feb. 25 and was above the $4 level at the end of last week. “Doctor Copper” has signaled that economic growth, inflationary pressures, or both, are rising quickly in the global economy.
The red metal soars to a decade high
The copper price has powered higher over the past four consecutive quarters after reaching a low of $2.5095 in March 2020. 
Source: CQG
The chart highlights the move to the highest price since July 2011.

Source: LME
LME three-month copper futures rose from below $4800 last March to the most recent high of over $9562.50 per ton. The all-time high in the LME forwards was at around the $10,000 level in 2011.
Stockpiles are low, but manipulation is common
Copper inventories on the London Metals Exchange remain at multi-year lows, fueling the bullish price action in the red metal. 
Source: LME/Kitco
The five-year chart shows that copper in LME warehouses fell from over 280,000 metric tons in May 2020 to 79,025 tons as of Friday, Mar. 5. Stock levels have made lower highs and lower lows since mid-2018 and were at the low at the end of February. 
Source: COMEX/Kitco
The chart highlights that over the past two months, copper inventories in COMEX warehouses declined from nearly 80,000 metric tons to 70,045 tons as of the end of last week.
While declining visible stockpiles is a bullish factor for the copper market, we need to view the data with a grain of salt. Copper and other base metal stockpiles can be manipulated by dominant market participants to influence prices.
When I was a trader at Philipp Brothers in the 1980s, the company’s famous copper chief Manfred Koppelman called moving stocks around to manipulate the red metal’s price “tampering with the market’s mechanism.” I tend to view significant stockpile moves with more than a little skepticism. However, the trends on the LME and COMEX suggest increasing demand for the red metal.
The case for new record highs in copper
Copper is rising and could move to a new record peak for three compelling reasons.
- Central bank liquidity and government stimulus are increasing the money supply and deficits. Simultaneously, they weigh on the purchasing power of money. Inflationary monetary and fiscal policies are bullish for all commodity prices, and copper is no exception.
- Optimism for the end of the global pandemic is prompting economic growth in China and worldwide. As the world achieves herd immunity to the virus, demand for raw materials is likely to grow. Moreover, the prospects for a US infrastructure rebuilding project could turbocharge copper demand as the base metal is an infrastructure building block.
- As the US and the rest of the world move towards a greener path for energy production and consumption, copper demand is growing. Copper is an essential requirement for EVs, solar power infrastructure, battery storage, and other clean energy initiatives. Meanwhile, the global semiconductor shortage is lifting copper’s price as the base metal is an excellent electricity conductor and an ingredient for many chipmakers.
Copper is becoming far more than an infrastructure building block as its role in technological solutions is increasing.
Risk rises with the price
Copper is a commodity, meaning its price action tends to be more volatile than other asset classes. The price move from $2.0595 to $3.3755 per pound in a little under a year is a reminder of the potential for wide price variance in the copper futures and forward markets.
The trend in copper remains higher, but the price action turned parabolic over the past months. The move to over $4 could launch copper to a decade high and threatens to challenge the 2011 record peak at $4.6485 and over $10,000 on the LME forwards.
The risk of a correction rises with the price of an asset in parabolic price trends, as we witnessed late last week when copper probed below the $4 per pound level on the nearby May COMEX futures contract. It is virtually impossible to pick tops or bottoms in any market. The higher copper flies, the greater the odds of a severe correction will rise. Bull market selloffs are typically brutal.
Levels to watch: Producers are golden, but costs are rising
The ultimate target for COMEX copper futures now stands at the $4.6495 record high. However, there is likely to be some technical resistance at the $4.54 level, the August 2011 peak. We could also see some technical selling around the $9,500 and $10,000 per ton levels on LME forwards as they are critical psychological prices.
Support for COMEX futures stand at around $4.00 per pound. Copper is likely to find further downside support at $3.4910, the late January low that gave way to the recent bullish explosion. We should expect wide daily trading ranges in the copper futures and forward markets.
The highest copper price in a decade has taken other base metals on the LME to multi-year highs. Aluminum, nickel, lead, zinc, and tin prices are rallying for the same reason as the red metal. The rallies’ beneficiaries are the companies that extract the ores and metals from the earth’s crust.
One of my favorite base metals mining products is the iShares MSCI Global Metals & Mining Producers ETF (NYSE:PICK). PICK's top holdings and fund summary include:
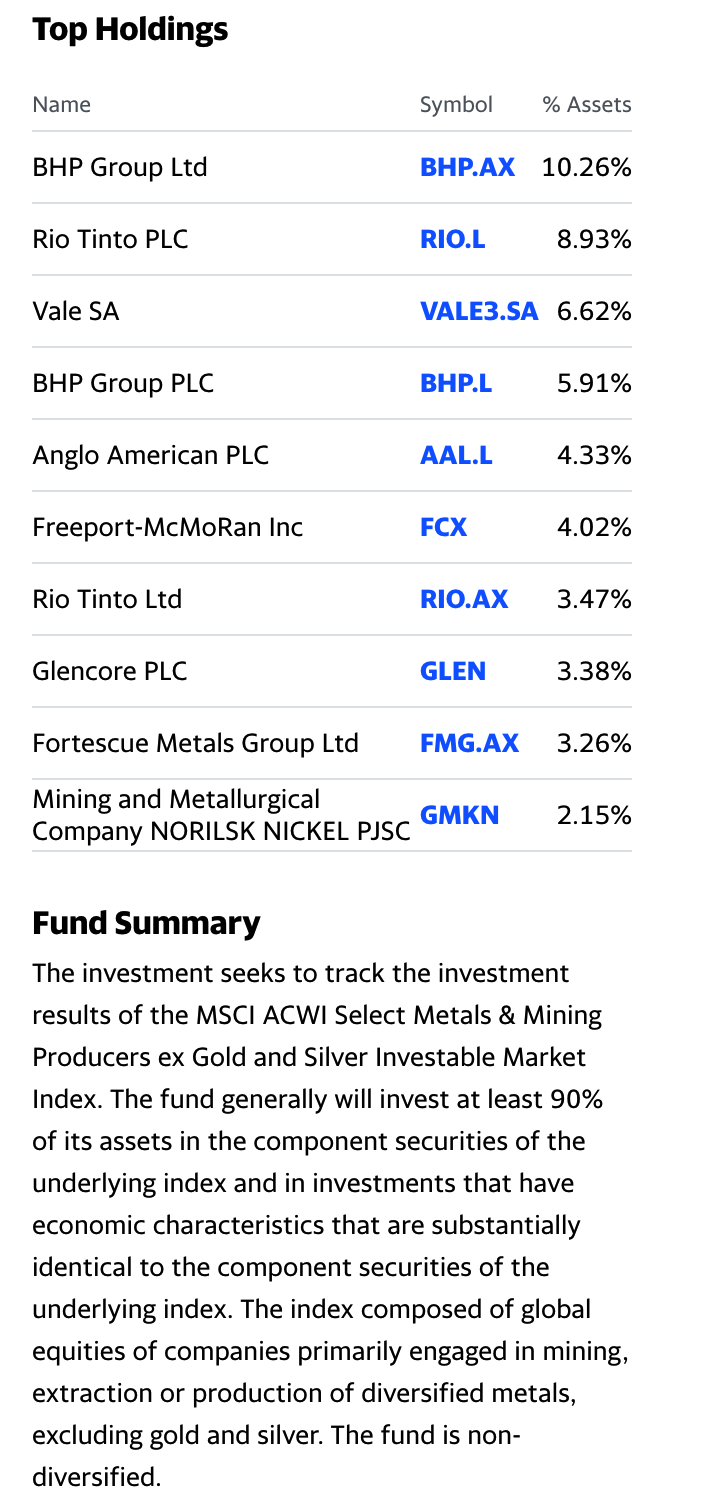
Source: Yahoo (NASDAQ:AABA) Finance
PICK holds the leading base metals mining companies worldwide, including BHP Billiton (NYSE:BHP), Rio Tinto (NYSE:RIO), Vale (NYSE:VALE) and Freeport-McMoran Copper & Gold (NYSE:FCX), that will see earnings soar with the metal’s price. PICK has net assets of $538.9 million, trades an average of 433,438 shares each day, and charges a 0.39% expense ratio.
The blended yield of PICK's holdings is around the 2.27% level. The dividend pays for holding the PICK ETF for a little over two months.
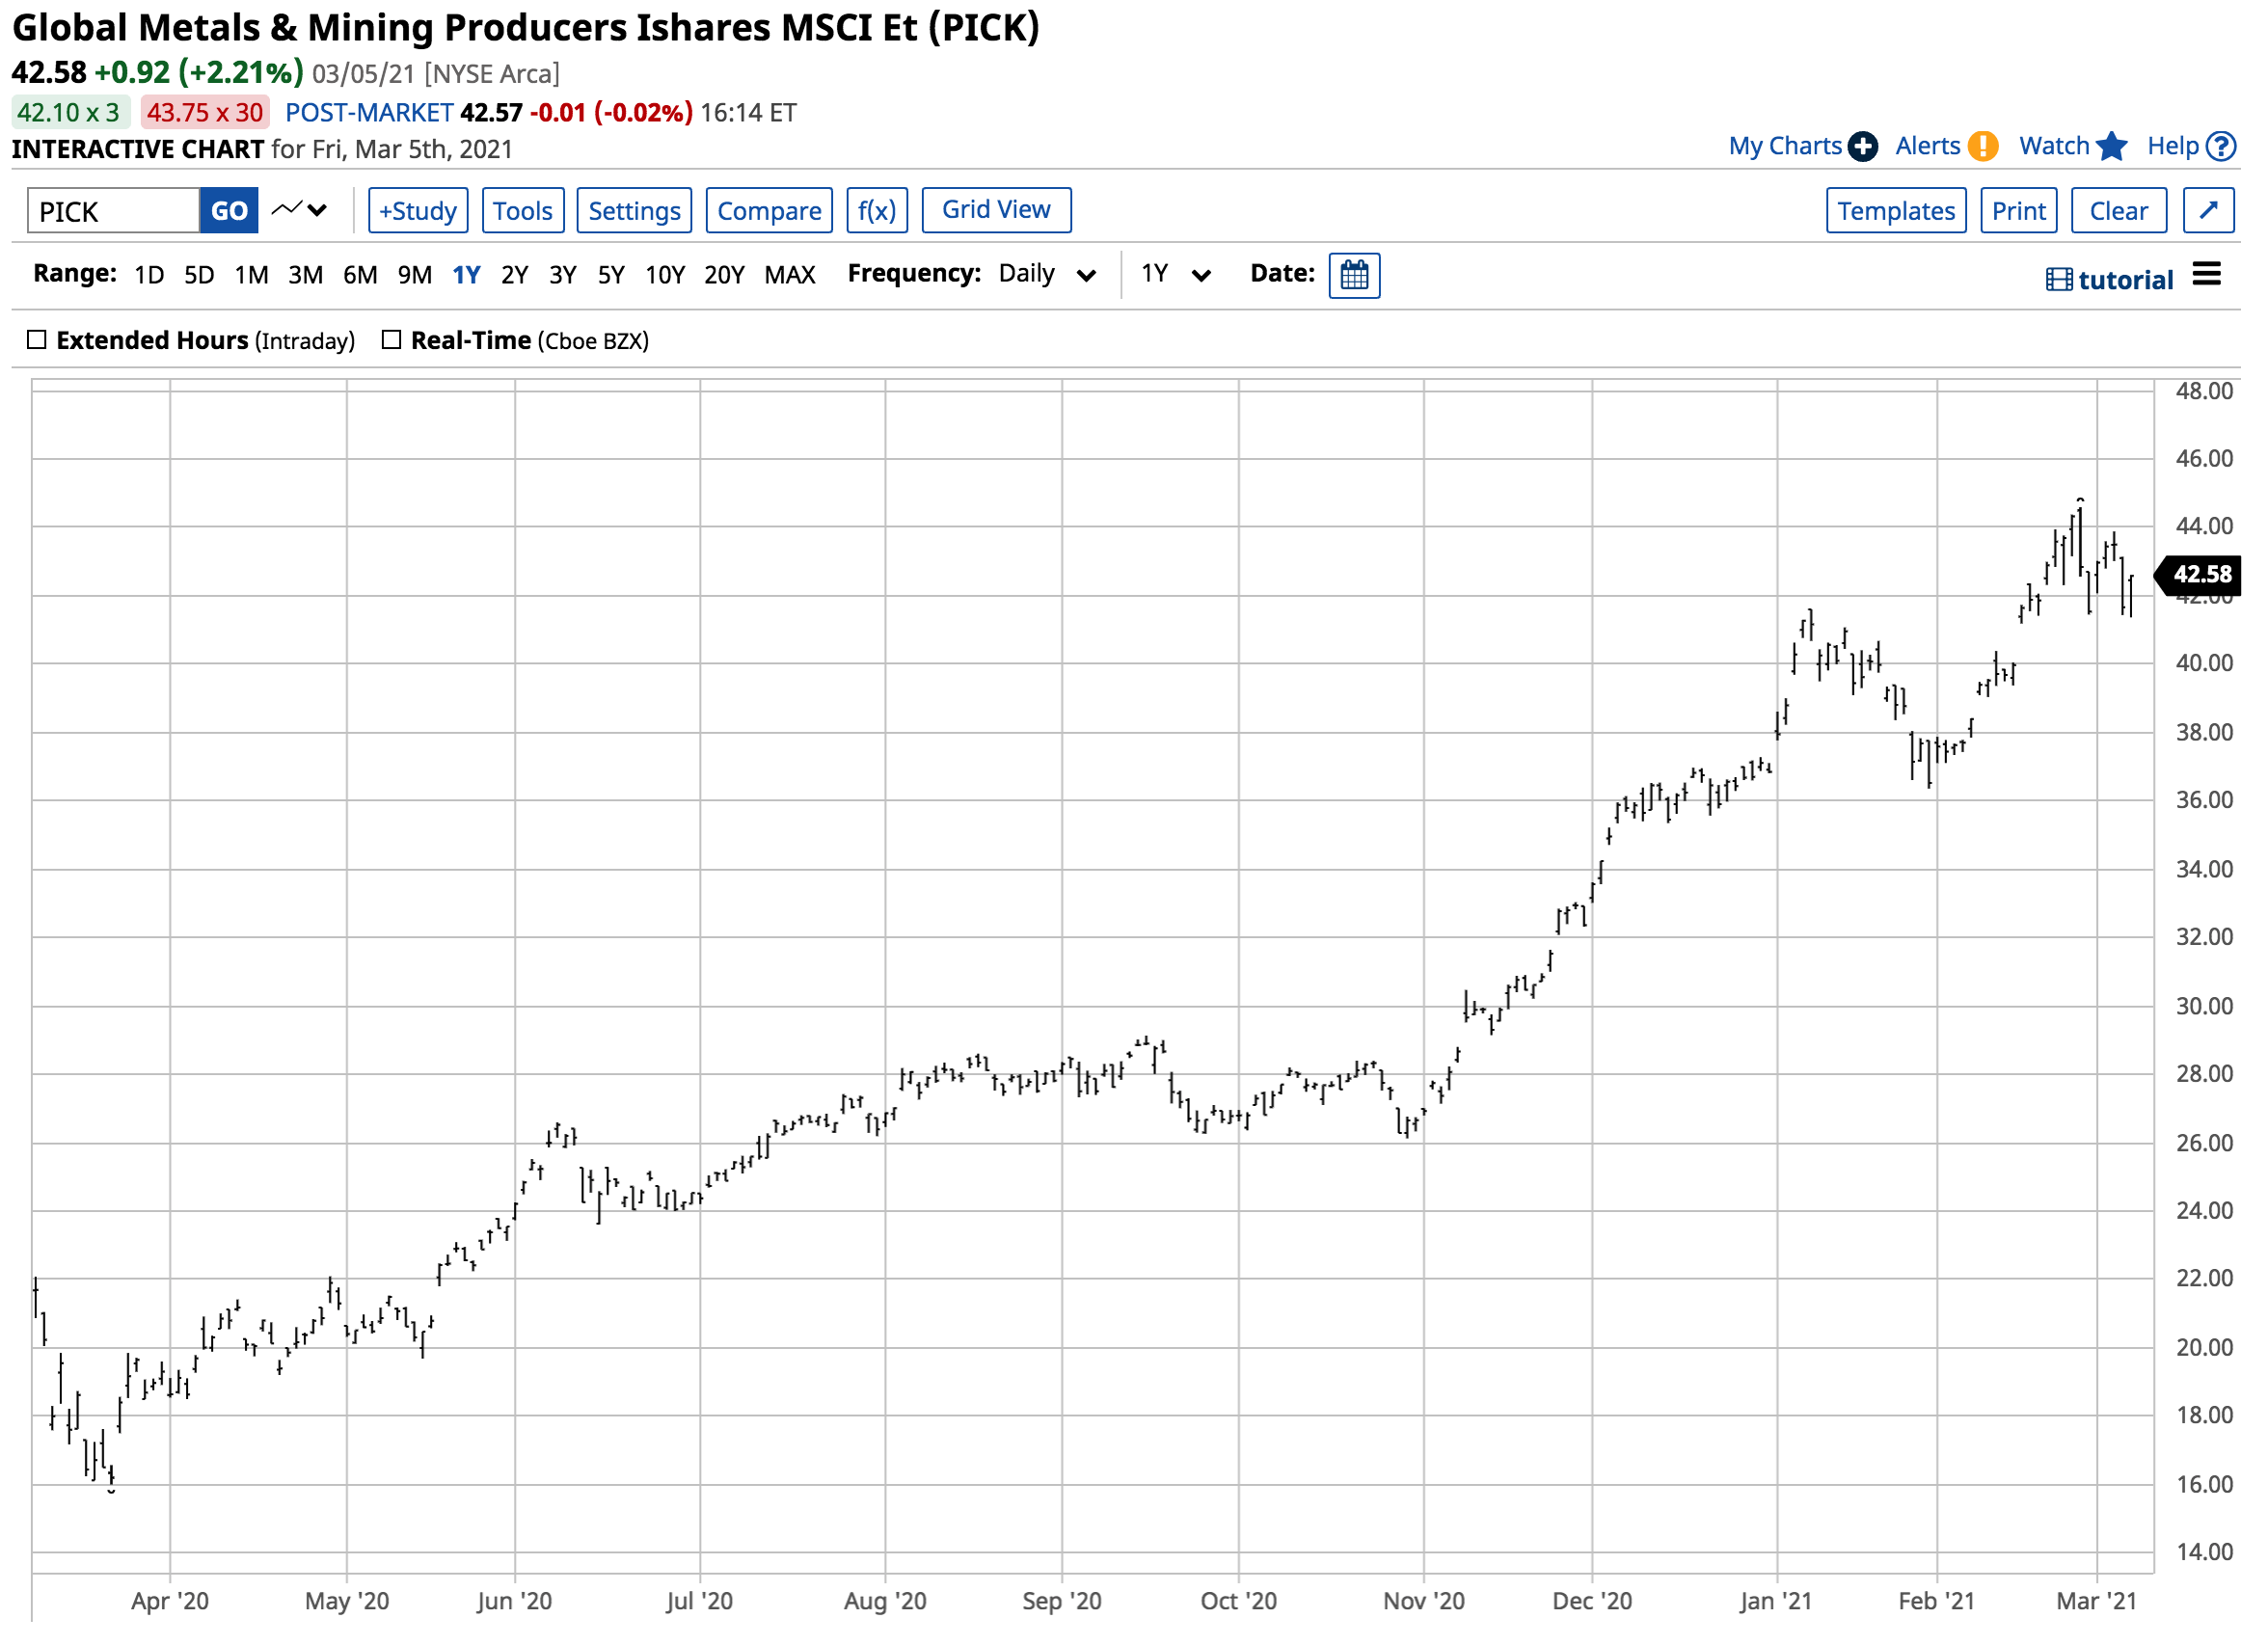
Source: Yahoo Finance
PICK reached a low of $16.01 per share in late March 2020 when base metals prices traded to bottoms. As of the end of last week, the ETF was at the $42.58 level, over 165% higher over the past year.
A bull market correction in base metals would cause PICK to decline. I would view any selloff in the ETF as a golden buying opportunity.
Keep an eye on the LME stocks published daily by the exchange. A sudden rise in warehouse inventories could be an attempt to push prices lower for buyers looking to pick up metal at lower prices. “Tampering with the market’s mechanism” remains a strategy employed by dominant market participants.
A Chinese entity has owned and controlled the London Metals Exchange since 2013. China is the demand side of the fundamental equation for base metals. As prices run higher, China may do a bit of tampering to create buying opportunities to secure supplies by pushing speculators out of the market at lower levels. Moreover, if the US is preparing to refresh and renew infrastructure, China and other traders will likely buy up supplies to sell them later to the US at higher prices.