Optimism over US-China trade talks will likely send agricultural markets from soybeans to hogs into an extended rally this week, amid a weaker dollar that could provide a boost as well to industrial commodities such as copper and oil.
Some raw materials could benefit from long-running positive themes. Wheat is one, with traders eyeing more of last week’s highs which were spurred by a drought in key grower Australia. Natural gas may be another, underpinned by concerns of low reserves for the upcoming winter heating period.
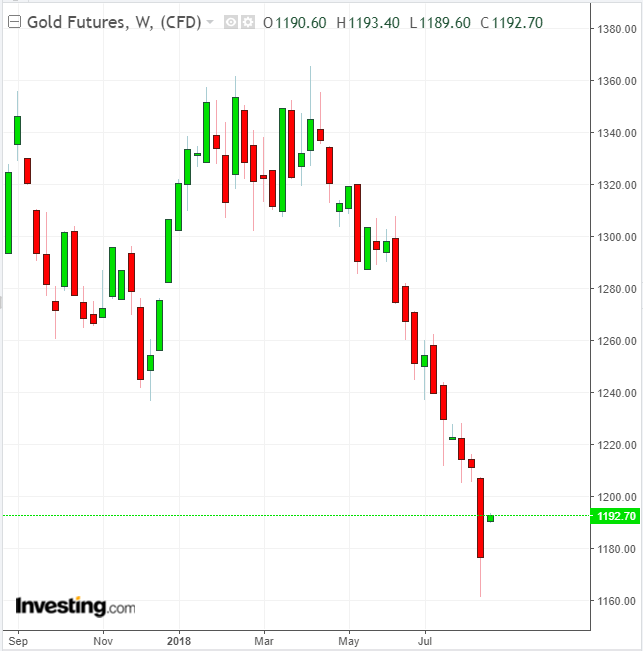
Not all commodities may rise though. Precious metals are expected to stick to their recent downtrend, with analysts saying more dollar weakness would be required to restore gold’s allure as a safe haven.

“Optimism on gold, silver, and platinum now ranks among the lowest in 27 years,” Blaine, Minnesota-based Sundial Capital Research said in a note last week.
Still, the dollar could see more profit-taking this week on speculation that the US and China may cut a trade deal ahead of President Donald Trump and Chinese leader Xi Jinping’s summit in November. The Dollar Index, measured against a basket of currencies, on Thursday posted its largest drop since late July after reports broke that China’s vice minister for commerce, Wang Shouwen, will lead a nine-member delegation to talks with U.S. officials on August 22-23, spearheaded on the US side by Treasury undersecretary David Malpass .
The dollar has become a de facto safe haven asset in recent months as the trade standoff led the two nations to slap tit-for-tat tariffs on each other. This week’s meeting would be the first since May. “We are skeptical that much will come out of this,” TD Securities said in a pre-weekend note, referring to the talks. “But … it pays to be prudent.”
Aside from trade war-related impact, the dollar also retreated last week on soft U.S. economic data and a bounce in the euro and yen. For this week, German inflation, EU consumer confidence and US manufacturing PMI and existing home sales are among data that could decide the dollar’s next moves.
Soy, Hogs Could Add To Gains
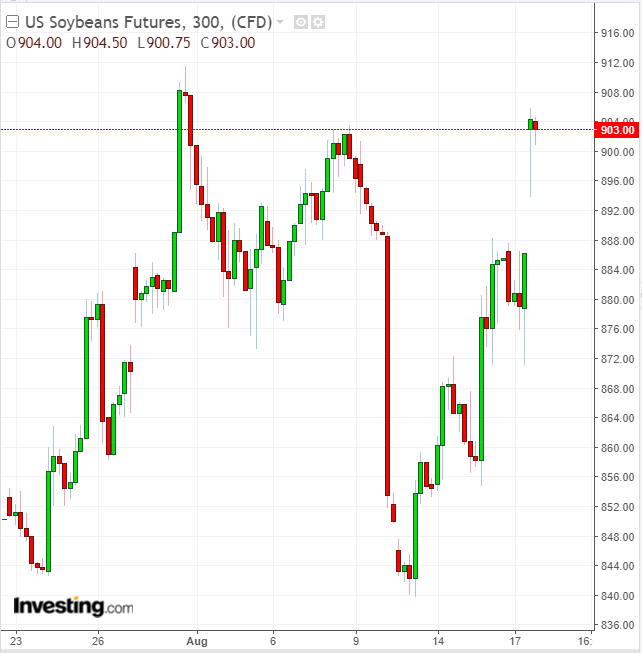
Soybeans, which have borne the brunt of the US-China trade spat because of Beijing’s 25 percent tax on US-grown soy, experienced its sharpest weekly gain in two months last week buoyed by the news that the two nations were to resume trade talks.

The 4.3-percent weekly gain brought the front-month September contract for US soybeans to a settlement of $8.8625 per bushel last week, above its 50-day moving average of $8.7428. That made it a “Strong Buy”, according to Investing.com’s daily technicals. With Level 3 Fibonacci resistance seen at only $9.0967 for September soybeans, the contract could have a further upside of 23 cents.
Over the past two session, the market hit limit-up on lean hogs, after Investing.com made the case last week for a hogs rally in the event of an easing in US-China tariffs concerns. Prior to last week’s near 6-percent gain, futures of lean hogs, the most common source for pork meat in the US, were down 25 percent on the year.
With the market’s reset, they are now deemed a “Neutral” holding by Investing.com’s daily technicals. After the benchmark October delivery contact settled at $5.860 per lb on Friday, Fibonacci patterns put strong support at $5.713 and Level 3 resistance at $5.999.
Wheat To Front-Run Grains Rally

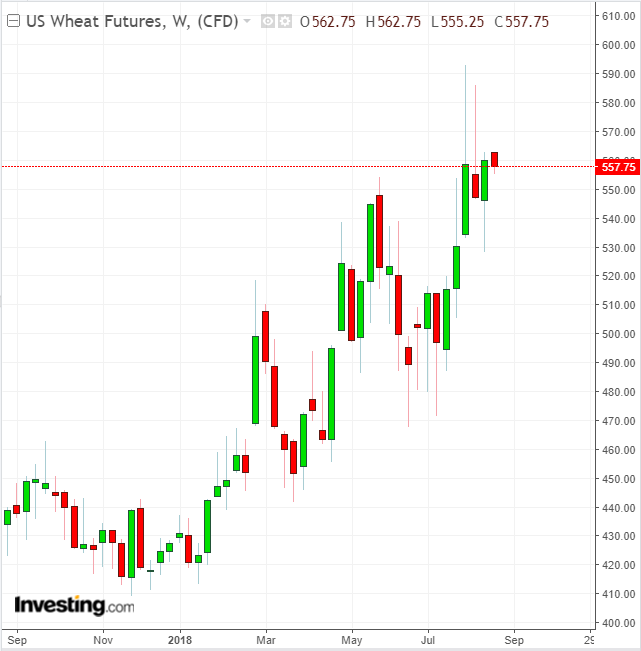
For wheat—the star of the grains complex with an annual gain of 31 percent—the potential upside became more accentuated after forecasts that Australia's September weather will be drier than in August. Last week’s 2.4-percent gain in wheat also came on the back of reports that Russia, the world's top wheat exporter, will consider restricting 2018-19 shipments to 30 million tonnes. Even before those restrictions, the global wheat market was already rocked by worries of reduced harvests in Russia’s Black Sea region, Europe and Australia.
At Friday’s settlement of $5.6000 per bushel for the key September contract, Investing.com’s daily technicals rate US wheat as a “Strong Buy.” Fibonacci patterns put strong support at $5.2383 per bushel and Level 3 resistance at $5.6683.
As for natural gas, weather forecasts are projecting a cooling trend over the middle section of the US, which might be bearish for air-conditioning and power demand, said Dominick Chirichella of the Energy Management Institute in New York. But that outlook was being offset by a bigger – and bullish – picture of thin gas stockpiles held in underground salt caverns for the winter, he said. “All models (are) projecting the deficit to continue right to the start of the upcoming winter heating season,” Chirichella added.
At Friday’s settlement of $2.946 per million metric British thermal units, September natural gas was deemed a “Strong Buy” on Investing.com’s daily technicals. Fibonacci patterns put Level 3 resistance for September gas at $2.974 per mmBtu.
