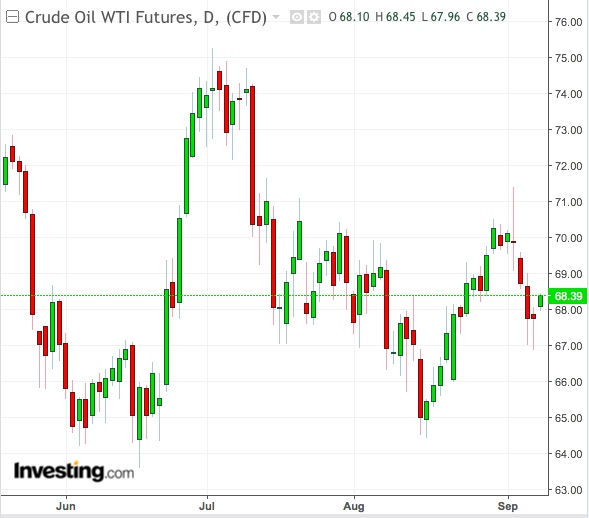
Donald Trump’s latest trade ultimatum to China could spark an investor flight across major commodity markets this week, amid weak technicals and potentially bearish reports from OPEC and other global energy agencies that might pressure US crude oil towards $65 per barrel.
With more investors expected to take refuge in the dollar, the currency should gain at the expense of gold, further eroding the safe-haven appeal of bullion. Among industrial commodities, copper and cotton may also be under pressure from the effects of the strong dollar and Trump’s trade warning to China. That could prompt long-only investors in commodities to seek gains from select markets that have rallied lately, such as wheat and cocoa.
On the economic calendar, investors will be on the lookout for rate decisions by the Bank of England and the European Central Bank on Thursday, and US retail sales numbers for August on Friday.
US-China Trade War Intensifying
Trump warned last Friday that nearly $500 billion in additional Chinese goods could come under US tariffs soon, narrowing Beijing’s chance of escaping the bilateral trade conflict without significant damage. Washington will act on $200 billion of tariffs “very soon depending on what happens,” Trump told reporters on the Air Force One presidential jet. “I hate to do this, but behind that, there is another $267 billion ready to go on short notice if I want.”
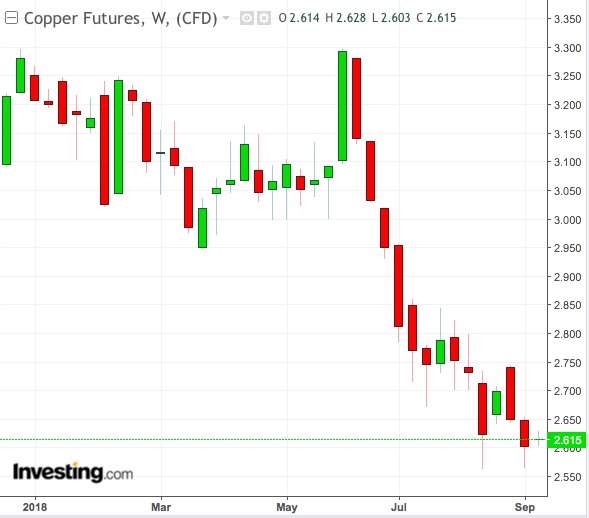
His caution would be chilling particularly to investors in copper, as the metal in scrap form is one of the biggest industrial commodities China buys from the US.
US data on commodity trader positions for the week ended September 4 showed speculators aggressively dumping bullish positions in copper in fear of Trump's previous warning on $200 billion of new Chinese tariffs.

The potential levy on another $267 billion of goods, which ironically might include Made-in-China Apple (NASDAQ:AAPL) products being shipped back to America, could send tremors beyond the copper market—a metal often used to gauge the health of the global economy.
Bearish Mood In Copper And Gold
“Considering the ebbs and flows of trade angst, which continue to bolster the mighty dollar and add pressure to copper prices, we suspect that traders will likely continue to shun the red metal's firm fundamentals for now,” TD Securities said in a pre-weekend note.
US copper for December delivery settled down 2.4 percent last week at $2.6225 per lb, garnering a “Strong Sell” recommendation on Investing,com’s daily technical outlook. Based on the strong Level 3 Fibonacci support of $2.6110, the contract might have to lose at least 1 percent more to attract a buy rating.
And while bullion appears to have established a floor at the $1,200 per ounce level, Investing.com’s technicals are “Neutral” on US gold for December, suggesting a buy if it returns to the 20-day moving average of $1,195.44.
Some say gold needs to drop further.
“I still believe that we will retest the August 16th low of $1,167 in the coming days ahead as the U.S economy is strong,” said Mike Seery of Seery Futures in Plainfield, Illinois.
Seery cited the US economy’s addition of 201,000 US jobs last month and the Treasury’s 10-year note yield of 2.94 percent as signs that the Federal Reserve will hike rates again, boosting the dollar. “I see no reason to own gold” for now, he said in summation.
More Downside For US Crude
In oil, traders and investors will be on the lookout for supply-demand reports from the triumvirate of oil agencies – the Energy Information Administration (EIA) of the US, the Organization of the Petroleum Exporting Countries (OPEC) in Vienna and the Paris-based International Energy Agency (IEA).

First will be the EIA's short-term energy outlook on Tuesday, particularly on oil price expectations. In its last short-term report for August, the EIA said it expects the monthly average of UK Brent oil to remain at $70 to $73 per barrel from August 2018 through 2019. Brent settled on Friday at $77.03.
Next up will be OPEC's report on Wednesday. Last month, OPEC revised down its 2019 world oil demand growth forecasts by 20,000 barrels per day to 1.43 million bpd due to weaker-than-expected demand from Latin America and the Middle East. At the same time, it revised up world supply growth forecasts, indicating an upward revision of 106,000 bpd to 61.75 million bpd in non-OPEC oil supply in 2019.
Also on Wednesday, the EIA will release its weekly oil storage report. While the last EIA weekly report had a US crude drawdown of 4.3 million barrels that was twice more than expected, an unexpected hike in total US oil products overwhelmed that figure.
Last in the series will be the IEA monthly report on Thursday. In its August supply, the Paris-based agency noted a material slowdown in global oil demand growth in the second and third quarters. It has predicted a rebound in the fourth quarter.
Analysts expect the net effect of these reports to be positive for Brent versus US West Texas Intermediate crude.
“This shift could lead to a wider Brent-WTI spread in 2019 than the $6/bbl we are currently projecting,” energy analysts at Bank of America said in a report.
With last Friday’s settlement of $67.75 per barrel for WTI, the difference between the two is already at around $10 in Brent’s favor.
Investing.com’s daily technical outlook also has a “Strong Sell” on WTI, with Woodie’s Level 3 support only emerging at $65.92.
