Silver is often forgotten by the market as its more expensive sister, gold, captures headlines and attracts endless analysis. However, the white metal might now be poised for some wild trading over the next few weeks. Specifically, a recently completed chart pattern could very well be a fractal of a larger pattern which is set to generate some major movements for silver.

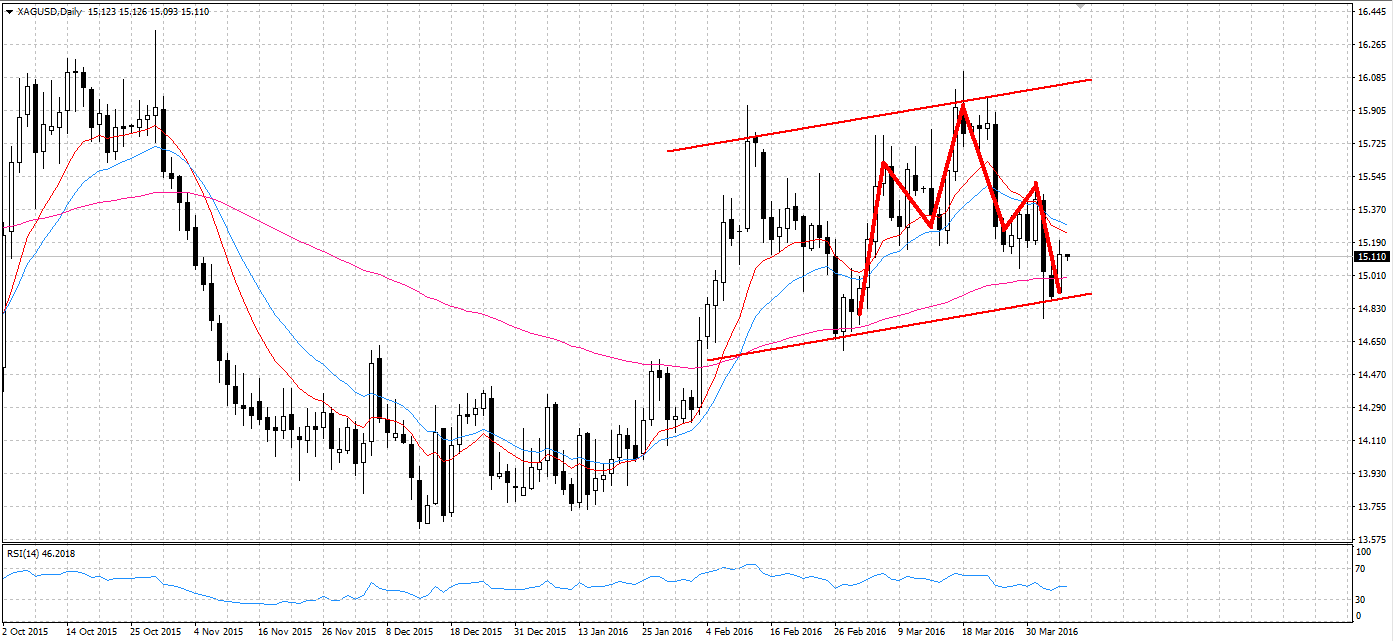
Firstly, silver has recently completed a head and shoulders pattern and now looks to be making a corrective movement within the channel. The head and shoulders pattern began to form around the 29th of February and completed on the 4th of April, ending when it found support at 14.88. Subsequently, the metal began moving back towards the centre of its channel after testing the downside constraint. As a result of this movement, silver could now be setting up to complete the final shoulder of a larger head and shoulders pattern which began on the 15th of January.
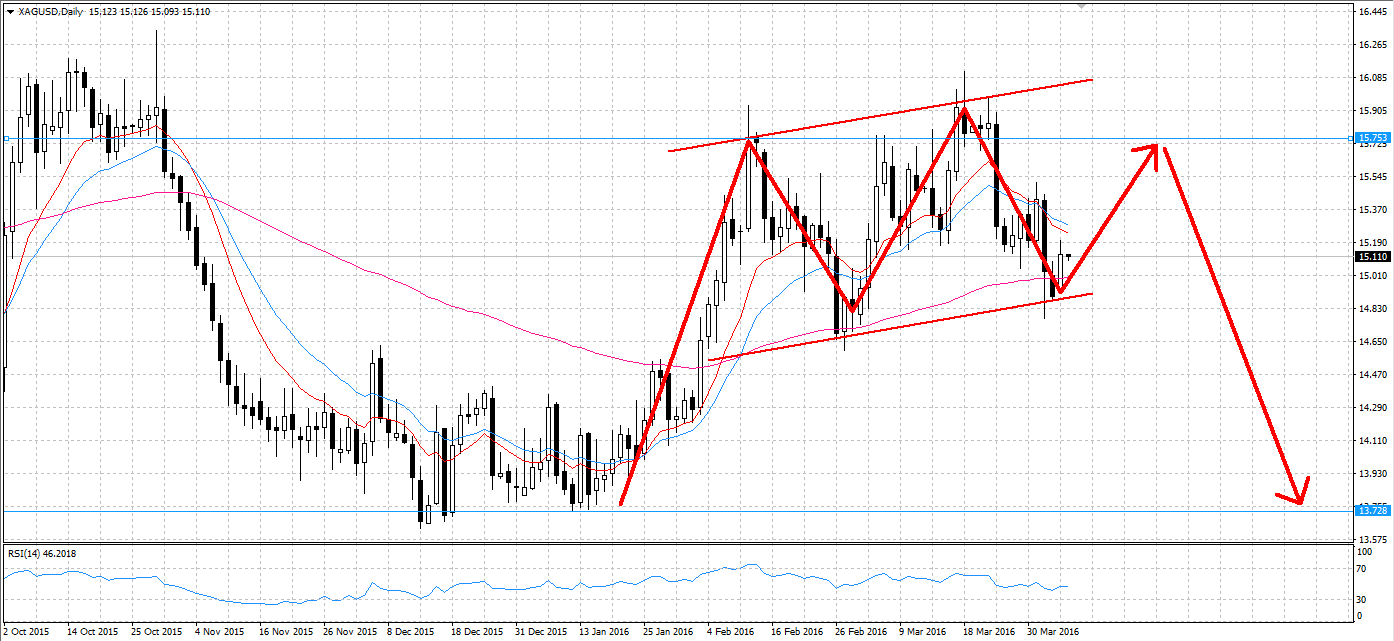
Consequently, the metal should now continue moving back to the shoulder zone of resistance at 15.75. The requisite momentum for another rally should be generated by the circulating fear around the USD. For example, the relatively poor US trade balance result of -47.1 billion managed to buoy silver to 15.11 by the end of its most recent session. As a result, any further underwhelming US results in the next week or so could certainly push the pair to form the final shoulder of this pattern.
Furthermore, the 100 day EMA has been providing dynamic support for silver throughout the larger head and shoulders pattern. As a result of recently moving below this support, the metal bounced back sharply as the dynamic support held firm. In subsequent days, we can assume this upward sloping 100 day EMA continues to drive silver towards that critical 15.75 zone of resistance. Importantly, as the metal draws near to this point, the RSI oscillator should provide a strong signal of when silver is about to reverse and take a plunge.
An overbought signal should indicate the beginning of the final leg of the head and shoulder pattern. As a result, once the pair becomes overbought around the 15.75 shoulder it can be expected that the metal will plummet. The resulting fall should find support around the 13.72 level which will complete the pattern in full.
Ultimately, this chart pattern requires a few more days of watching before a true head and shoulders pattern is confirmed. However, there is significant movement on the cards for silver which could provide some interesting viewing in days to come. Who knows, silver might finally outshine the markets favourite metal for a brief moment before becoming the “poor man’s gold” once more.
