The Chinese yuan is slated to resume its earlier decline as U.S. President Donald Trump prepares to sign the Senate's bill supporting the Hong Kong protesters.
After a year and a half of wrangling over their elusive trade deal, the U.S. and China decided to break it down into phases, to allow them to sign onto the parts they are able to compromise on. However, it seems that the two countries can’t even agree on the first phase, as China demands a tariff rollback concurrent to the signing of Phase I, while the U.S. insists that China hasn’t done enough for a trade resolution.
As well, the U.S. senate's Hong Kong human rights legislation has raised China's ire against the U.S. In reaction to the news, investors sold off stocks and bought havens. President Trump is now expected to sign the bill, ignoring Chinese threats.

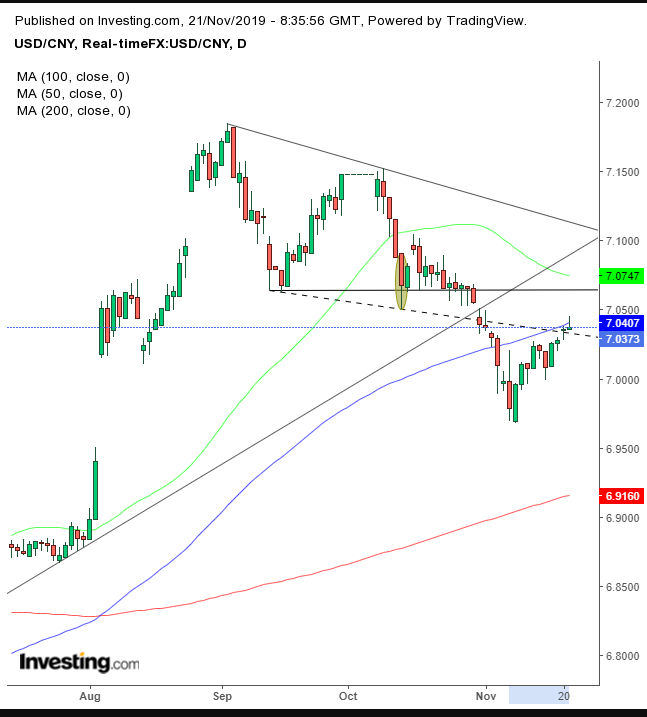
The trade war first grabbed the headlines in March 2018. Lo and behold, that was when the USD/CNY pair bottomed. It then climbed steadily, until September, partly due to the promise of a trade deal. However, the pair has been dropping since then, possibly completing a descending triangle on Oct. 30. It then crossed below the uptrend line since April 2018 on the very next day, Oct. 31.
We say the symmetrical triangle is probable, not definite, because of a single day’s intraday low, on Oct. 11 (green elliptical), which is traced with its own (dotted) line. Some technicians would argue that price action is important too and may reflect the trend and its implied dynamics.
However, irrespective of the triangle’s interpretation, the price did fall below the long-term uptrend line, which, in fact, would support the argument for the preceding bearish pattern.
Today is the tenth session in which the pair is rebounding from the Nov. 8 bottom — and the price is weakening. It attempted to cross over the 100 DMA but retreated below, forming a shooting star at the very trendline (dotted), which would form the bottom of a falling channel. For those who view that two-month range between September and November as a symmetrical triangle, the recent rise is a corrective move after the downside breakout and the current pressure confirms the pattern’s bearishness.
Meanwhile, the price has formed two peaks and troughs since the Sept. 4 high. Conservative analysts would demand another peak and trough, independent of the previous uptrend and below the Nov. 8 low, which would retest the 200 DMA. Moderate investors may rely on the Oct. 14 low mentioned above — that allowed for the dotted line — and the Oct. 16 high, as an additional peak and trough, forming a downtrend.
Meanwhile, based on the technicals, investors overall still believe a deal will be signed, or — at least according to this asset — the dollar would not be weakening at this point, against the yuan.
Trading Strategies
Conservative traders would wait for a fall below the 200 DMA.
Moderate traders may rely on resistance as a trend confirmation, expressed as at least one long, red candle.
Aggressive traders may short at will, providing it fits their trading plan.
Trade Sample
Note: This is a sample to demonstrate what basic elements to include in each trade. It will not necessarily succeed. Trading success or failure is measured after enough trades are taken to be statistically representative.
