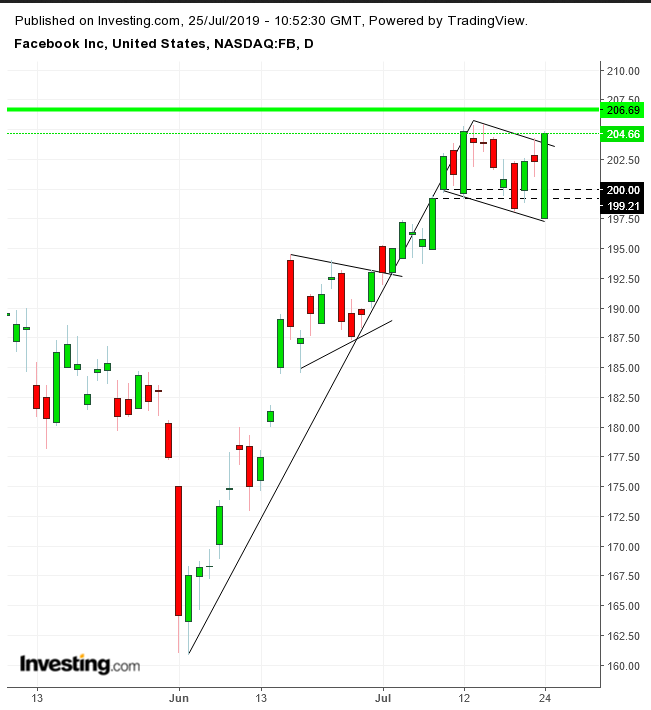
Traders may have been flummoxed at the way in which Facebook (NASDAQ:FB) yesterday recovered from a drastically lower open after being hit with a $5 billion fine for privacy abuse.
Of course, the stock's miraculous rebound from a three-week low to a two-week high came before the earnings beat, which was reported after-hours. The jump came as a knee-jerk reaction to the news, which turned out to be positive, after investors had time to consider the numbers.
Facebook's settlement with the Federal Trade Commission, which amounts to no more than what the social media monster makes monthly, was a huge win for the company, whose accountants and lawyers must have been expecting a bigger hit from what now appears to have been a hasty and superficial FTC investigation. Indeed,the settlement may garner good will among Facebook users and clients, under the assumption that Facebook paid for its mistakes and won’t repeat them. All in all, a very good deal for the media giant.
As investors learned of and disseminated the outcome of the probe, which had created a tricky headwind during the last year, yesterday’s after-market corporate results should now ensure a sustained rally. Facebook reported EPS of $1.99 and revenue of $16.95 billion, beating the expected $1.87 EPS and $16.5 billion revenue.
The chart demonstrates that the supply-demand balance has tipped the scale in favor of bulls, ending a standoff between buyers and sellers.

The price has ranged since it opened higher on July 10. The rising gap provided support. The congestion had a downward bias – forming a falling flag, considered bullish in an uptrend – as buyers were steadily absorbing all the supply provided by previous bulls, starting June 4. Midway, some buyers took earlier profits, forming a pennant shaped continuation pattern June 18-28.
Yesterday’s close completed the pattern after breaking to the topside, demonstrating that after all the selling, buyers were still not satiated and wanted more, prompting them to raise bids to find fresh willing sellers. The strong earnings after market pushed after-hours prices even higher. The current quote in the pre-market is $206.68, 1% higher than the closing price, marked by the green line, further deepening the breakout.
The Facebook settlement deflated a major headwind, paving the way for investors to retest the July 25, $218.62 all-time high, with the implied target of the bullish flag turning it to a hop, skip and a jump.
Trading Strategies – Long Position Setup
Conservative traders are likely to wait for a 3-percent penetration to above $210, then wait for a potential pullback that demonstrates support.
Moderate traders may be content with only a 2% breakout to $208 to filter out a bear trap, then they may wait for a return move to limit exposure, not necessarily for confirmation.
Aggressive traders may go long with a close above $206, waiting for a 1% filter. Then, they could wait for a down-move to either retest the pattern – with at least one long green candle engulfing a red or small candle of either color – or for a closer stop-loss.
Trade Sample
- Entry: $205
- Stop-Loss: $203
- Risk: $2
- Target: $211
- Reward: $6
- Risk-Reward Ratio: 1:3
