December boom: Where to find the highest returns
Gold has been falling for a fourth straight day, losing over 5% during the current slump. It's the longest as well as sharpest drop for the precious metal since before the March bottom.
For the month of September thus far, the yellow metal is down 6.61%. That may seem surprising, given its position as a safe haven asset, which normally thrives when risk appetite falters, illustrated by the S&P 500 which is down 7.6% over the same period, on track for its worst September in 18 years.
There's one immediate catalyst for this unexpected development: gold has been suffering from the unlikely dollar rebound. The currency is up 2.5% this month, with multiple, conflicting themes claiming responsibility—the coronavirus risk-off, seen via equities, while some economic data has improved, even as the Fed’s Evans warned that the central bank might raise rates sooner than expected.
Does this mean that gold will necessarily continue to weaken? Not at all.
Rather, the dollar is up for the moment, but faces an exceptionally uncertain fundamental environment along with serious technical resistance which could cause it to return it to its medium-term decline. In addition, gold could decouple from the USD and recalibrate with equities, reclaiming its haven status once again.
The next move for gold is a complex trade, with multiple, even conflicting drivers. As such, we're hesitant to predict what the precious metal's next moves might be. Instead, we'll simply describe the technical scenarios and outline expectations.

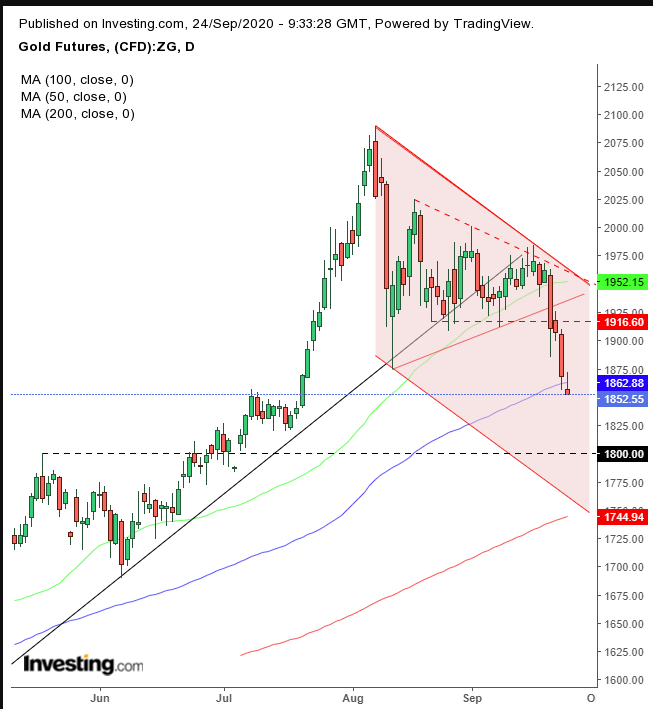
Gold's technical chart has been evolving since August, generating a variety of changes. After the precious metal's decisive, downside breakout, in which gold fell below its Aug. 12 low, we see several triangular patterns—the symmetrical triangle from the Aug. 7 top to the Aug. 12 low; a smaller symmetrical triangle from the same Aug. 12 low to Aug. 18; and, finally, a descending triangle from the Aug. 18 high toward the lows which began on Aug. 21 (red dotted lines).
Other than measuring the implied objective, we know this pattern tends to follow a downside breakout, which is bearish.
The moving averages reveal how the technical pressure-points are spread throughout the chart. The price fell below the 50 DMA, which supported the triangle. Today, the yellow metal is contending with the 100 DMA, halfway down the falling channel, while the 200 DMA rises to support its bottom.
The downside breakout would indicate that the trajectory will continue lower, at least in the near term, but that may not necessarily occur. While the short-term trend, as shown on the daily chart, established a downtrend, the medium and long term trajectories—as plotted on the weekly and monthly charts—are in an uptrend.
That doesn’t necessarily mean it’s unreasonable to go with the short-term trend, but traders must be prepared to be whipsawed when the longer-term trends take over.
Trading Strategies
Conservative traders would wait for gold to make a new high above its Aug. 7, $2,089.20 all-time high and join the long-term uptrend.
Moderate traders may risk a short position if all the stars align: a return move to the pattern, resisted by enduring supply, with at least one long, red candle.
Aggressive traders may also wait for a corrective rally for a better entry, not necessarily to test the trend. Considering going against the longer-term trends increases risk, so tight money management is crucial. Here’s an example:
Trade Sample
- Entry: $1,915 – Descending triangle-bottom, the lower triangle
- Stop-Loss: $1,940 – Symmetrical triangle-bottom, the higher triangle
- Risk: $25
- Target: $1,800 – May 18 peak
- Reward: $100
- Risk:Reward Ratio: 1:4
Author's Note: A trade sample is just an example of one of many possible ways to approach the same trade. Your personal circumstances—timing, budget and temperament—will have a substantial impact on the results. If you don’t write consistent plans, you will not develop statistical results. In essence you'll simply be gambling. Trading success or failure is not measured by a few trades but by producing statistically sound samples. Good trading!
