Recently, we've been discussing the current market debate regarding the potential for inflation to raise its ugly, or lovely, head—depending on how you interpret the phenomenon.
The positive outlook sees reflation as good for the economy, with rising prices fueling economic expansion, allowing companies to increase profits and ramp-up hiring and wages, thereby enabling consumers to spend more. This reading creates a virtuous, upward spiraling cycle of manageable gains.
The negative view anticipates economic overheating, wherein the expansion becomes unmanageable and prices rise too quickly. In this scenario, with prices escalating ahead of corporate profitability and consumer buying power, ultimately the economy spirals lower.
Naturally, at this stage, one can't know which interpretation of the theme will prevail, but we can illustrate how to trade each version of the inflation narrative in order to hedge and ideally incur a profit.
Today we'll consider the industrial metal copper, which would benefit from the reflation trade as economic expansion prevails. Tomorrow, we plan to write about platinum, the precious metal that usually gains when it's used as a hedge against rapidly rising inflation.

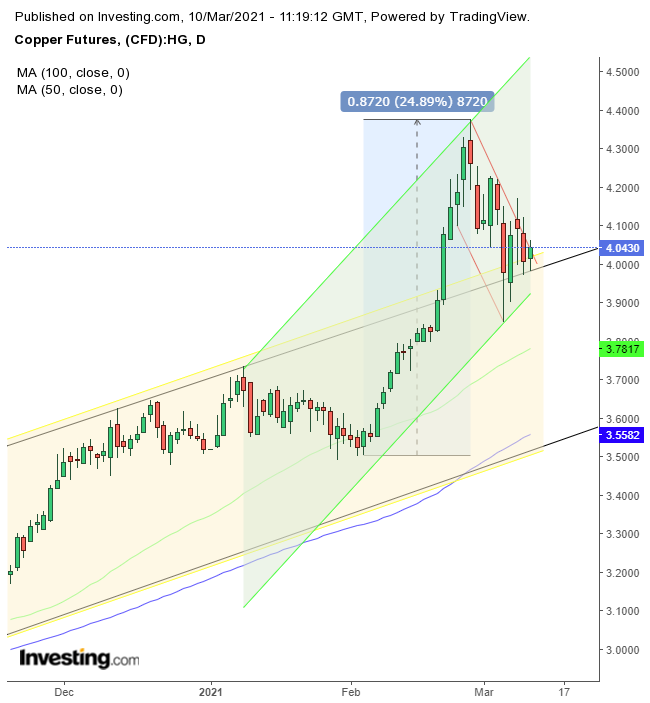
The red metal has enjoyed a 25% surge in just three weeks, from the low of Feb. 3 to the high of Feb. 25. It reached its highest level since Aug. 2011 and is now approximately 5% below its Feb. 14 all-time high.
That move broke the rising channel in which the contract was traded since the March low.
Obviously, when buying overtakes selling, it propels prices higher as stronger demand produces weaker supply. What's interesting in this case, however, is that the same traders appear to be playing both sides of the game.
When the balance tilted in favor of demand, the metal was able to change course and rise more quickly. If we’re right, the previous 25% is the first half of one move.
The flag is the range created when early bulls took profit, as they considered whether they'd gone too far. Note that the decline is much slower than the preceding advance.
That’s because traders appear to have been in agreement that prices should go higher. The congestion within the flag illustrates that consensus is gone.
Whereas the sellers were early bulls who wanted to preserve what they’d already gained, the goal of the later bulls was to profit in the same way the sellers had. So, the flag is falling because it's being pressured by profit taking. Still it’s persisting because all that selling is finding hungry new bulls, eagerly picking up every contract sold.
In technical analysis, it’s important to look at the entire picture, to find the order within the chaos, the method within the madness. Notice that the flag has been finding support above the earlier rising channel.
Also, note, the 50 DMA is realigning with the now faster rate of ascent, while the 100 DMA crossed above the bottom of the early rising channel for the first time.
Copper Futures Contract Specs
- Contract Unit: 25,000 pounds
- Price Quotation: dollars and cents per pound (therefore multiply each price change by 25,000 to arrive at the contract change value.
In other words:
- Minimum Price Fluctuation: 0.0005 per pound = $12.50
Trading Strategies
Conservative traders should wait for the flag to complete, with an upside breakout, whose penetration would pierce the 4.2000 level, then return after the short squeeze is over, to retest the pattern’s integrity, whose persistent demand will send the price up in another wave.
Moderate traders would wait for the upside breakout to exceed 4.120, then would wait for a buying dip, if not evidence of support.
Aggressive traders could buy at will, provided they understand the dynamics and accept the risks. A trading plan is key.
Here’s an example:
Trade Sample
- Entry: 4.0000
- Stop-Loss: 3.9000
- Risk: 0.1000 (X 25,000 = $2,500)
- Target: 4.3000
- Reward: 0.3000 (X 25,000 = $7,500)
- Risk:Reward Ratio: 1:3
Author's Note: This is just a sample and it's not offered as the only way to approach this trade, whose interpretation may be wrong. We do not know the future but are merely weighing the evidence. We base our expectations on statistics, which occur over time. The more you trade the greater the chance you have to align with statistics. Therefore, in addition to analysis, money management is crucial. Your timing, budget and temperament will impact your overall trading. Till you learn how to customize a trading plan, gain experience by trading small,as a way to learn. If you’re here to make big bucks fast, you're statically guaranteed to lose all your money, then blame it on analysts and decide trading is gambling. Do both of us a favor and heed our advice.
