Inflation in the U.K. has now scaled above the Bank of England’s 2% target, and London economists expect annual consumer price inflation to reach 2.1%. If they are right, it would be the fastest pace since December. Of course, interest rates often travel in the wake of inflation, and if prices continue to rise, any potential rate action would make an impact on sterling too.
But will prices continue to rise? As things stand, it's very likely—the rise in Inflation was probably driven by rising oil prices, which don't look like they'll drop any time soon. OPEC members have signaled clearly that production cuts will remain in place for the foreseeable future, while the sabre rattling between the U.S. and Iran is adding further fuel to the fire under prices.
All of this suggests further and continuous upward pressure for U.K. inflation. And if these developments continue to play out, the BoE may have little choice but raise interest rates, which would in turn support the pound. The charts offer some insight into how to potentially trade the U.K. currency in this uncertain period.

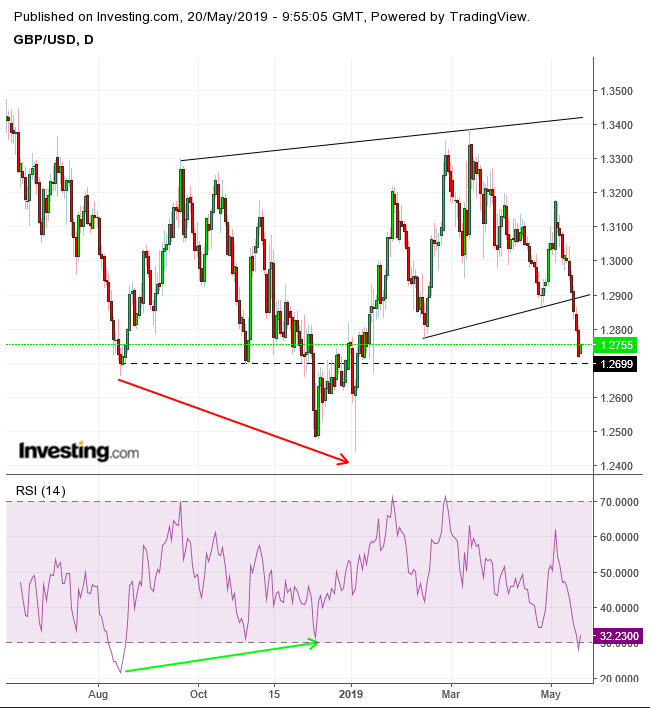
The pound may have completed a H&S top since late January. The current rebound may come as a natural pullback following the downside breakout. However, it could also represent the support provided by the support ranging from Aug. 2018 – Jan. 2019, increasing the potential of a massive H&S bottom, starting August, whose neckline forms the connecting highs at the 1.3400 level.
The RSI supports that scenario, having provided a positive divergence when momentum—as seen on the RSI—rose even when prices were falling. This divergence suggests that the selling momentum is weakening, setting itself up for a rise—in this scenario, with enough juice to break topside of the H&S bottom. Also, note, the RSI found support at its lows since October.
Having said that, the price is still within the smaller H&S top pattern, and it needs to climb back above the neckline at the 1.3000 level to cause a pattern failure, itself a bullish signal.
Trading Strategies
Conservative traders would wait for a decisive upside breakout of the H&S bottom, with a close at least above 1.36, followed by a return move that proves the neckline’s support, with at least one long, green candle engulfing a red or small candle of either color.
Moderate traders might short if the price returns to the smaller, H&S top’s neckline, at about 1.3000, and demonstrates resistance, with a minimum of one long, red candle following a green or small candle of either color.
Aggressive traders may enter a long position now, after the RSI reached an oversold condition and the price has two reasons to rise, on either scenario: (1) a pullback to the smaller H&S top, or (2) continuing along the pattern of the larger H&S bottom.
Trade Sample
- Entry: 1.2750
- Stop-Loss: 1.2700, below Friday’ slow, supported by the Aug.-Jan. lows
- Risk: 50 pips
- Target: 1.2900, the round number below the H&S top neckline
- Reward: 150 pips
- Risk-Reward Ratio: 1:3
